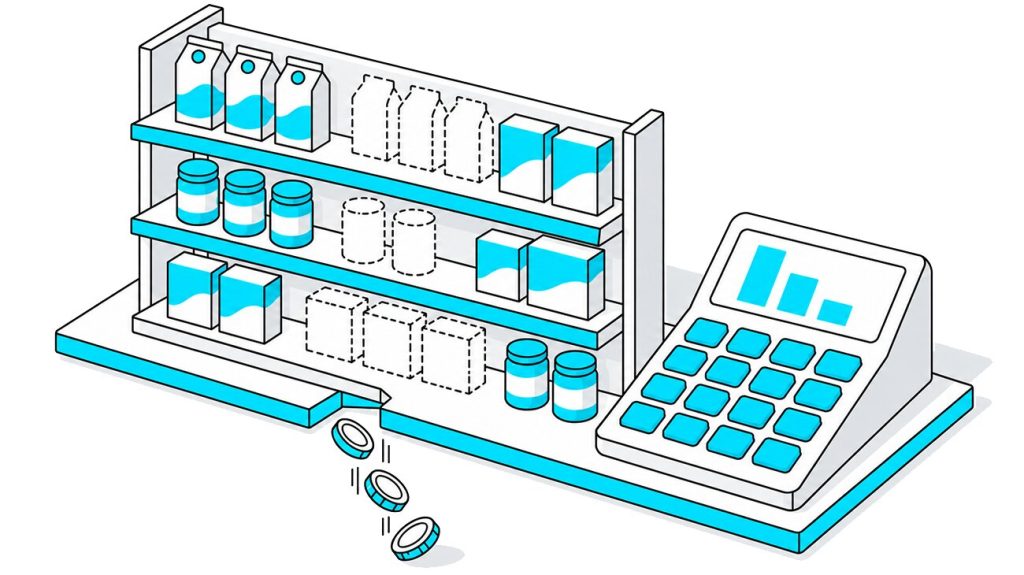

Some CPG teams learn that a store has changed the planned layout on the same day. Most learn it at the next audit, several weeks after the reset. During those weeks, store staff fill out-of-stock positions with neighboring products and adapt the layout to fixtures that differ from the plan. Each change lowers planogram compliance, that is, the share of the shelf that matches the approved plan, and the promotion often ends before anyone corrects the shelf.
The size of the difference depends on the category and the retailer, and few companies measure it in every store. In one Goods Checker project, a chain of about 500 gas stations found that only 50% of its soft drink displays matched the planogram before the chain began to check shelves by photo. Part of the cost appears as products that shoppers cannot find. NIQ estimates that out-of-shelf situations, where a product is absent from the shelf, cost the US retail industry $69 billion in 2023.
This article explains why planogram compliance fails, what the differences between the plan and the real shelf cost in on-shelf availability and sales, and how companies measure and reduce them.
Table of Content:
- Key Takeaways
- What Is Planogram Compliance and Why It Matters More Than You Think
- Planogram vs Real Shelf: Where and Why They Drift Apart
- The Cost of Planogram Non-Compliance: OSA, Phantom Inventory and Lost Revenue
- Measuring Planogram Compliance in Stores: From Sampling to Full Shelf Visibility
- How to Fix Retail Execution Gaps in CPG: From Static PDFs to Living Planograms
- How Goods Checker Turns Your Planogram into a Living, Measurable Document
- Your Planogram Only Works If the Shelf Matches, and That's a System Problem
- FAQ
Key Takeaways
- The shelf matches the planogram on the reset day. After that, file versions, fixtures, out-of-stocks and staff workload change it, and store discipline is only one part of the problem.
- A planogram deviation can reduce OSA, contribute to inventory discrepancies and weaken promo execution, and manual audits report it after the sales are lost.
- Photo audits with computer vision give compliance data on the day of the visit, and the data is useful when category teams apply it to the next planogram.
What Is Planogram Compliance and Why It Matters More Than You Think
Planogram compliance is the degree to which the actual shelf matches the approved planogram.
“There is no single universal compliance formula. Teams may score SKU presence, correct facings, correct positions, or a combination of these factors. For that reason, two companies can report different compliance percentages for the same shelf unless they use the same scoring rules.
For a simple presence-based score: Planogram compliance = compliant planned positions / total planned positions × 100%. “

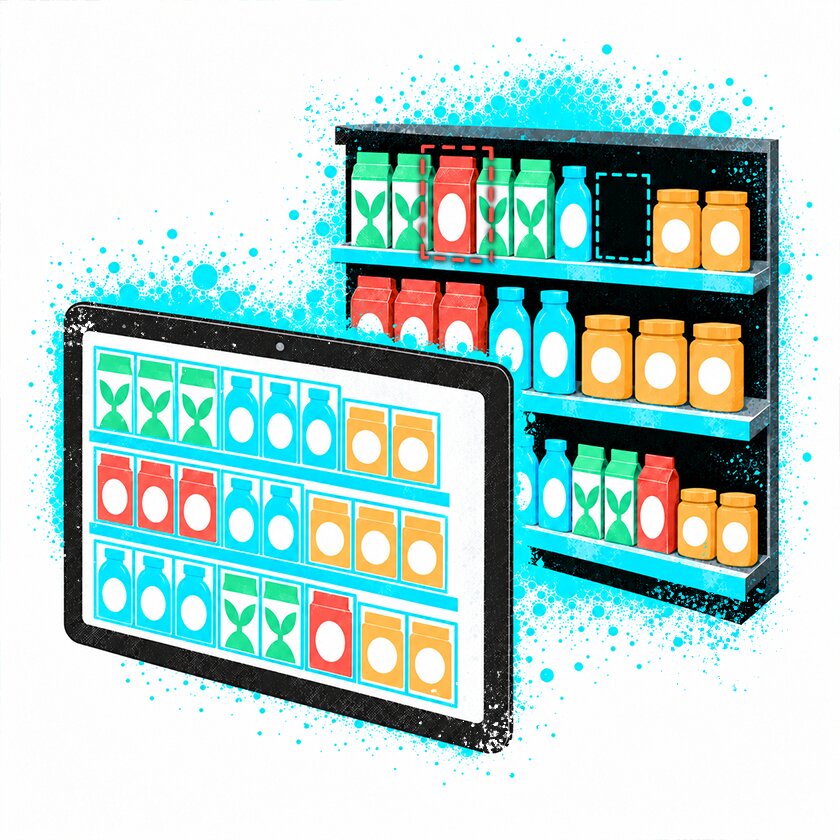
An auditor or a recognition system compares five things: which SKUs are on the shelf, where each one stands, how many facings it has, which shelf level it occupies, and which products stand next to it.
A facing is one unit of a product that the shopper sees from the front. We explained how teams build planograms in our planogram guide, so this article covers only what happens after the reset.
The metric matters because three commercial results depend on it:
- On-shelf availability (OSA), the share of planned SKUs that a shopper can find on the shelf at the moment of the visit.
- Share of shelf, the part of the category space that a brand occupies and often pays for.
- Promo execution, because a promotion can deliver its intended uplift only when the display is executed during the promo period.
Low compliance can affect all three metrics, but not every deviation has the same commercial impact. A misplaced slow-moving SKU is different from a missing promoted bestseller. We discuss which shelf metrics affect sales in our merchandising KPIs guide.
Planogram vs Real Shelf: Where and Why They Drift Apart

Store employees and merchandisers work with the tools, fixtures and time that the company gives them. Five conditions explain most planogram vs real shelf differences, and together they answer the question of why planogram compliance fails.
Version Chaos and Outdated Planograms
Many companies still send planograms as PDF or MS Excel files by email. A category gets a base version, a seasonal version, a promo overlay and regional variants, and each file reaches stores at a different time. No system tells a store manager which file is current, so the company has no single source of truth, that is, one place where everyone sees the same latest version.
On the shelf this produces a mixed layout. One store resets the category from a file that is two versions old, and another applies the new plan to half of the bay. An operations manager of a grocery chain, quoted in a 2026 article on store-level execution, said that the company plans with fresh data but has to “execute at the speed of email.”
Fixture Constraints and Store-Specific Reality
A planogram describes a standard fixture, while each store has the fixtures that it installed over the years. Shelf height, depth and the number of levels differ between formats, and a small store may lack the module that the plan requires.
“When the planned facings do not fit, the employee adapts the layout to the fixture in front of them. They cut a facing, move a SKU to another level or leave a product in the back room. The decision is sensible for the store, but headquarters does not learn about it, and the next planogram repeats the same error.”
Out-of-Stocks, Substitutions and Space Swaps
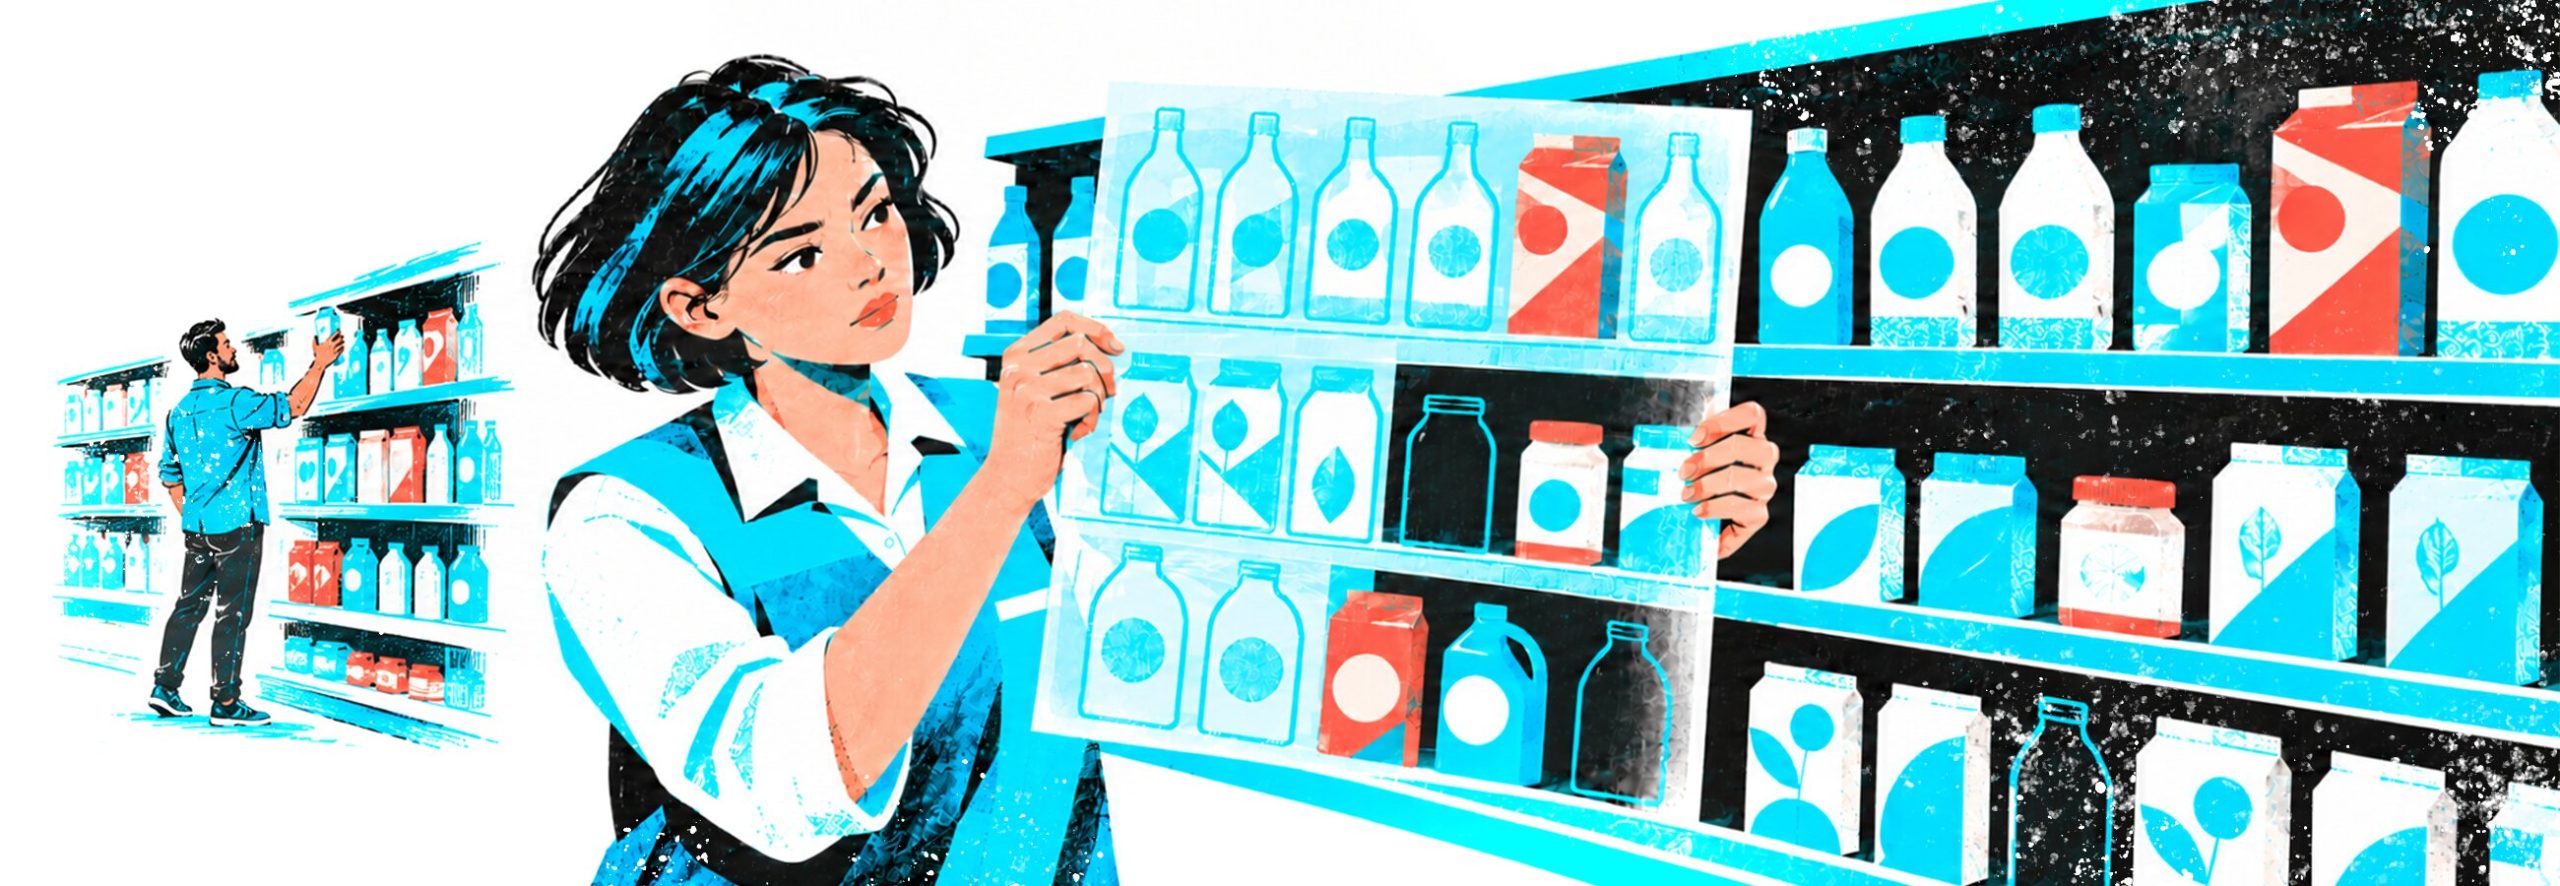
A delivery is late or the order was too small, and a SKU sells out. An empty space looks bad to the shopper and to the store manager, so an employee fills it with a product that is nearby.
Example. A promoted SKU is missing on Monday, and the employee extends the neighboring product into its space. The delivery arrives on Wednesday, but the substitute stays where it is, because nobody has a task to move it back. The promoted SKU now waits in the back room during its own promotion. The brand loses the sales the paid placement was meant to generate.
Staff Turnover, Training Gaps and Competing Priorities
Retail has high staff turnover, and stores add seasonal workers before peak periods. A new employee often gets a short introduction and may never see the planogram for the category they restock. Experienced staff handle checkout, receiving, promo setups and customer questions in the same shift.
When a queue forms at the checkout, the manager sends people there, and the reset waits. Staff put products where space is free, because the immediate task is a full shelf and a short queue.
Manual Audits and Slow Feedback Loops
Most companies check shelves during field visits that take place once every one to four weeks. An auditor photographs the shelf, compares it visually with a PDF and fills in a spreadsheet. The report reaches headquarters days or weeks later.
Example. A brand launches a four-week promo planogram, and stores complete the reset on day one. By the end of the first week, part of the stores have substitutions and missing facings. The audit records this in week three, the report arrives in week four, and the promotion ends before anyone can correct the shelf. The company learns what it lost but can no longer change the result.
The Cost of Planogram Non-Compliance: OSA, Phantom Inventory and Lost Revenue
Each deviation costs little, and for this reason companies rarely calculate the total. The losses become visible when a team looks at how a planogram deviation affects availability, then inventory data, and then revenue.
Lower On-Shelf Availability (OSA) and More OOS
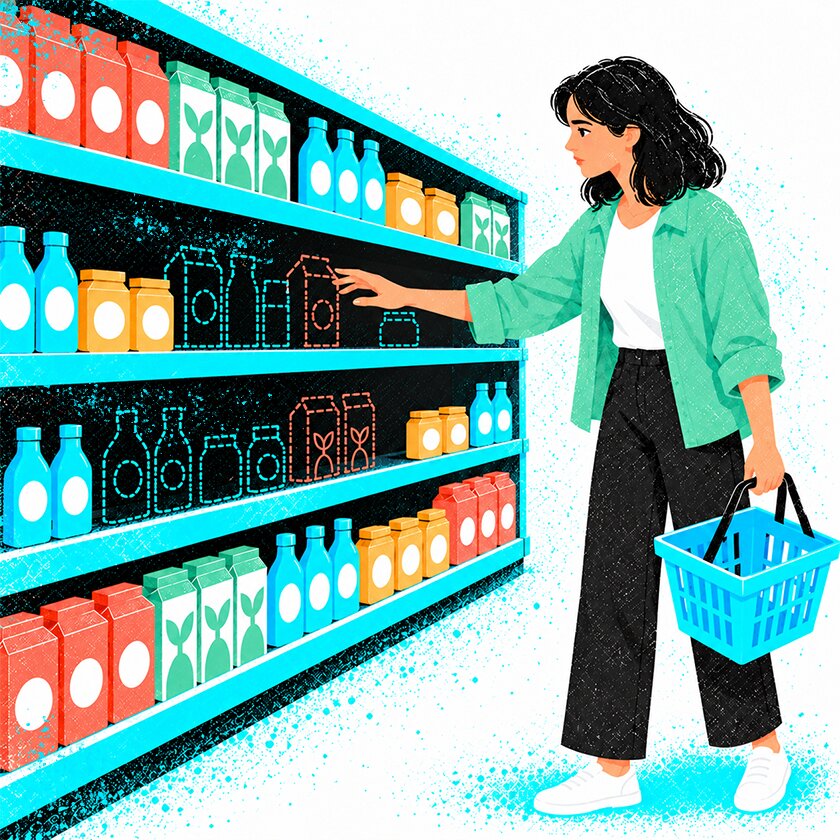
A wrong layout hides real out-of-stocks. When a neighboring product occupies the space of a missing SKU, the shelf looks full, and nobody orders the missing product or brings it from the back room. The opposite also happens. The SKU is in the store but stands on another shelf under another price tag, and the shopper who looks for it in the usual place does not find it.
In both cases OSA falls, although the store may have the product. For more on how to fix out-of-stocks in FMCG and what they cost, see our article on the consequences of out-of-stock.
Phantom Inventory and Distorted Replenishment
Phantom inventory is stock that the store system records as available while the shopper cannot find it on the shelf. Planogram non-compliance creates it in two ways. A reset happens earlier or later than the system expects, so the system counts units for a position that the shelf does not have yet. Or a SKU stands in a place where neither the system nor the staff expect it.
The system sees positive stock and does not reorder. It also sees zero sales and interprets them as weak demand, so the next forecast and the next order decrease. The phantom inventory problem in retail is large. Retail Insight, a UK provider of store operations software, reported in October 2023 that retailers’ inventory records are on average only 60% accurate and that phantom inventory can cause up to 80% of out-of-stocks. We compare the two problems in Out of Stock vs. Phantom Inventory.
Lost Sales, Weakened Promotions and Brand Visibility Risk
The direct loss is revenue and margin. A promo display that exists only in the plan produces no sales uplift, although the brand has paid the promo fee and produced the materials.
Example. A brand pays a retailer for a secondary placement, such as an end cap, for one month. In part of the stores, staff remove the display after two weeks and give the space to another supplier. The brand receives no report, pays for the full month and later sees weak sales that it cannot explain.
The loss also affects the next negotiation. Retailers review facings by sales per SKU, so a product that stood in the wrong place sells less and can lose space at the next range review. We describe how to check promo displays in our article on trade promotion ROI.
Measuring Planogram Compliance in Stores: From Sampling to Full Shelf Visibility
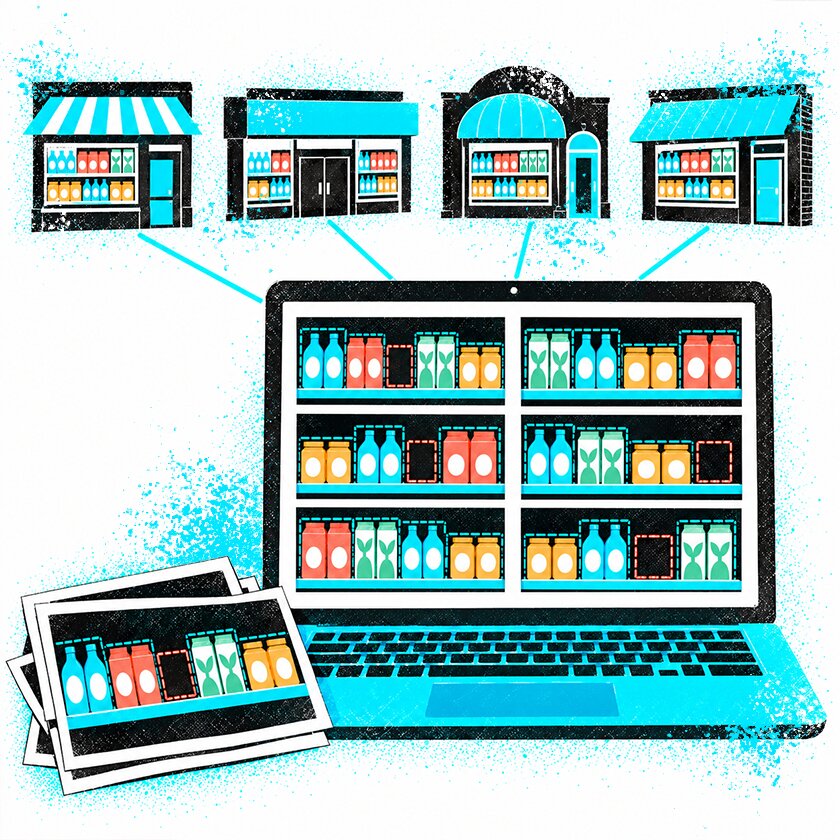
Companies use three approaches to measuring planogram compliance in stores. The approaches differ in how many stores they cover, how often they check each store, and how fast the result reaches the person who can act on it.
Traditional Store Audits and Photo Checklists
Field teams visit stores on a schedule, take photos by checklist and compare them with the planogram visually. The method doesn’t need to buy new software, and many companies still use it. Its limits are clear. An auditor visits a sample of stores, two auditors score the same shelf differently, and headquarters receives the result after the shelf has changed again.
Planogram Compliance Software and Digital Store Profiles
Planogram and retail execution software solves the version problem. The system sends the current planogram to each store, links it to a specific fixture in the store profile and replaces email attachments. Staff confirm the reset with digital checklists and photos, and managers see a compliance score by store and by team.
Computer Vision and Real-Time Shelf Execution Monitoring
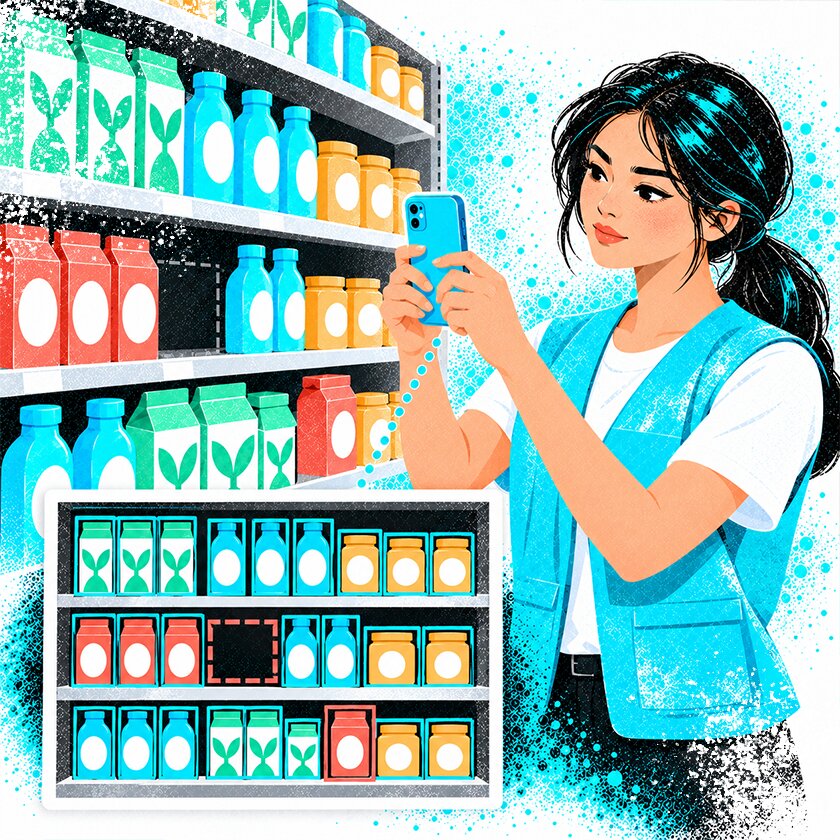
Computer vision removes the manual comparison. A merchandiser or a store employee photographs the shelf, and the system recognizes each SKU, counts facings and shelf levels, and compares the result with the reference planogram. Within seconds it calculates compliance, OSA and share of shelf and lists each deviation.
The gain is frequency and objectivity. Every visit becomes an audit, the same rules apply to every store, and the report reaches the manager the same day.
How to Fix Retail Execution Gaps in CPG: From Static PDFs to Living Planograms

Tools alone do not fix retail execution gaps in CPG. The company also has to change how it treats the planogram and what it does with shelf data.
Treat Planograms as Operational Models
A planogram is a hypothesis about what will sell and what will fit on the fixture. The shelf tests this hypothesis every day, and the category team needs the test results. A “living planogram” is a plan that the category team revises on a regular cycle with shelf data. Data leads to a planogram, the planogram leads to a reset, and the reset produces new data.
Close the Loop: From Shelf Data Back into Planning
Compliance reports often stay with the field team. Category managers need them as well, together with OSA and sales by store. If an SKU fails to keep its position in one fixture type across dozens of stores, the cause is the plan, and the fix belongs in the next planogram version.
Combine Planogram Compliance with OSA and OOS Reduction
A compliance score is useful only together with business results. Teams that link it to OSA, out-of-stock rate, lost sales and promo sales can see which deviations cost money. This helps them set priorities. A missing facing of a bestseller needs a fix today, while two slow SKUs that changed places can wait for the next visit.
How Goods Checker Turns Your Planogram into a Living, Measurable Document

Goods Checker is a computer vision platform for shelf audits. It works next to planogram software, ERP and supply chain systems and exchanges data with them through API.
Photo-Based Shelf Audits with Computer Vision
A merchandiser or a store employee photographs the shelf in the mobile app. The system recognizes products at SKU level with accuracy above 95%, compares the photo with the planogram and calculates planogram compliance, OSA and other shelf KPIs. In the gas station project, operators scanned a QR code on each cabinet, and the app opened the planogram for that exact fixture. Planogram compliance rose from 50% to 90% across about 500 stations.
Detecting Planogram vs Shelf Differences and Phantom Inventory in Real Time
The report lists each deviation, such as a wrong number of facings, a product in the wrong location, a missing SKU, or a planned quantity that does not fit the shelf. When the photo shows no product on the shelf and the store system still records stock, the team has a potential inventory discrepancy to investigate: the SKU may be in the back room, misplaced elsewhere in the store, or recorded as phantom inventory.
Using Compliance Data to Improve Retail Execution in FMCG
Companies use this data in three ways.
- Supervisors assign tasks to merchandisers and stores according to actual deviations.
- Key account managers bring photo evidence to the retailer and discuss how stores carry out the agreed facings and promo placements.
- Category managers see which parts of a planogram stores cannot carry out and change the next version.
A merchandising agency that uses Goods Checker in more than 4,500 outlets cut audit time per store by 60% and reporting time by 70%.
Your Planogram Only Works If the Shelf Matches, and That's a System Problem

A planogram raises sales only when the shelf matches it, and for most companies the reset day is the only day when they know that it does. After that, file versions, fixtures, out-of-stocks, staff workload and slow audits change the shelf, and store discipline does not explain any of these causes.
Companies that reduce the difference measure planogram compliance and OSA in every store and get shelf data on the day of the visit. They also return that data to category planning, so that the next planogram fits the stores better. Computer vision tools such as Goods Checker handle the measurement, and the result depends on how the company uses the data.
FAQ
What is planogram compliance in retail?
It is the degree to which the actual shelf matches the approved planogram by SKU, location, number of facings, shelf level and neighboring products. Companies report it as a percentage of positions or of stores.
Why does planogram compliance fail in CPG?
Stores receive several planogram versions by email, fixtures differ from the plan, out-of-stocks lead to substitutions, staff have little time and training, and audits report problems weeks late.
What are the most frequent planogram vs real shelf differences?
Missing SKUs, fewer facings than planned, products on the wrong shelf level, substitutes in the place of out-of-stock items, and promo displays that stores removed early or never built.
How do planogram execution gaps affect OSA and out-of-stocks?
Substitutions hide empty positions, and shoppers cannot find misplaced products, so OSA falls even when the store has stock. The store system keeps counting the product as available and does not reorder it.
How can brands measure planogram compliance across hundreds of stores?
Manual audits reach only a sample of stores. Brands that need data from every store use photo audits with computer vision, where each field visit or a photo from a store employee produces a compliance score the same day.
How does computer vision help close the planogram compliance gap?
It recognizes SKUs and facings in a shelf photo, compares them with the planogram in seconds and lists each deviation. Staff fix the shelf during the same visit, and category teams get data for the next planogram.