

In 2026, no one accepts “the shelf looks great” as a performance report. Category managers want sell-out data. Commercial directors ask how a planogram change affected gross margin. Sales VPs want to know whether the promo display in Zone B actually moved units.
In modern retail, merchandising effectiveness is increasingly measured through revenue contribution, margin protection, inventory turnover, and customer experience outcomes rather than visual standards alone. And that has created a real problem: most teams are drowning in KPIs. Weekly compliance scores, monthly photo audit summaries, dashboards with 30+ indicators, each from a different system with a different lag. But more data rarely means better decisions. Usually, it means more confusion.
This guide explains what merchandising effectiveness means in practice, which merchandising KPIs are genuinely connected to P&L, and which ones create only the illusion of control. It also covers how computer vision and tools like Goods Checker make shelf data objective and scalable.
Table of Contents
- What Is Merchandising Effectiveness?
- What Are KPIs in Merchandising and Why They Matter
- Types of Merchandising KPIs Retail Teams Use Today
- Merchandising KPIs That Truly Drive Sales and Margin
- Vanity Metrics and the Illusion of Control in Merchandising
- Examples of KPIs for Different Merchandising Roles
- Methods for Assessing Merchandising Effectiveness and KPIs
- How Technology and Goods Checker Transform Merchandising KPI Tracking
- Building a Practical Merchandising KPI System (Without the Noise)
- Measure What Changes Shelves and P&L, Not Just Reports
- FAQ: Merchandising KPIs and Retail Performance Metrics
What Is Merchandising Effectiveness?

Merchandising effectiveness is how well in-store execution drives business results. Shelf layout, visual presentation, planogram compliance, display placement — all of it should move sales, protect margin, and improve the shopper experience.
Effective retail merchandising is not about a store looking visually appealing in isolation. It is about execution decisions translating into measurable commercial outcomes.
A strong merchandising function connects shelf decisions to sales results. A weak one tracks internal scores that no one in the commercial team cares about.
Three questions define effective merchandising assessment: Is the shelf doing what we planned? Is that plan actually selling? And how quickly can we find and fix what is wrong?
What Are KPIs in Merchandising and Why They Matter

Merchandising KPIs are the measurable signals that tell you whether your execution is working. Without them, merchandising management relies on gut feel, periodic store visits, and optimistic field reports.
KPIs matter because they create a common language between people who work on the shelf and people who work on P&L. A visual merchandiser tracking how long shoppers spend in a zone and a commercial director tracking gross margin are looking at different data, but both should be able to connect their numbers to the same business outcome.
KPIs make execution visible and comparable across locations and time periods. Without KPIs, merchandising discussions quickly become subjective. One regional manager says execution is strong. Another says stores are underperforming. Comparable metrics eliminate that ambiguity.
Besides, KPIs help teams prioritize, because not every store deviation is equally important. They also make it easier to learn from what you test. For example, if a new display concept runs in 20 stores, KPIs show whether it worked well enough to scale.
Most teams have plenty of metrics. The challenge is picking the right ones and actually using them to make decisions.
Types of Merchandising KPIs Retail Teams Use Today
Before diving into specific metrics, it helps to understand how merchandising KPIs are typically grouped. Different teams track different things, and not all metrics carry the same weight. Here is an overview of the main ones.

Sales and Profitability KPIs
These are the metrics that matter most to commercial and finance teams.
Revenue and gross margin impact measure whether merchandising initiatives are driving sales and protecting margin. Sales per square foot (or per linear meter) is useful for comparing productivity across different store formats and shelf configurations. Sales per facing shows how much each visible unit position is contributing, which matters when deciding how to allocate limited shelf space. Sales per display or zone tells you whether a promotional fixture or in-store zone is earning its floor space.
Campaign ROI connects a specific execution investment, such as a display build, a planogram reset, or a seasonal layout change, to the incremental revenue it generated. Average transaction value (ATV) and basket size are also worth tracking, particularly for products where cross-sell and proximity placement influence what ends up in the basket.

Conversion and Traffic KPIs
These metrics describe how shoppers interact with the store and whether execution decisions are influencing their behavior.
- Conversion rate is the share of store visitors who make a purchase. Broken down by zone or category, it shows where the store is losing shoppers and where execution may be failing.
- Foot traffic patterns reveal how shoppers navigate the store, which aisles they enter, and where they stop.
- Stopping power measures the share of passers-by who pause at a display — a direct signal of how compelling the visual execution is.
- Dwell time (the time a shopper spends in a zone or in front of a display) correlates with engagement and, in many categories, with conversion.
- Revisit rate — how often shoppers return to a specific zone during a single visit — can indicate confusion, decision difficulty, or genuine interest.

Shelf, Planogram and Visual Execution KPIs
These are the operational metrics closest to what field teams and merchandisers control directly.
- Planogram compliance is the percentage of shelf positions that match the agreed planogram.
- Time-to-execution measures how quickly a planned reset or update is implemented across the store network.
- Share of shelf (SOS) tracks the proportion of shelf space occupied by a brand or product relative to competitors or total category space.
- Visual display impact captures whether a display is achieving its intended visual standard — a precursor to conversion metrics.
- Sales lift by display connects execution to outcome: it measures the uplift in sales for products placed in secondary display positions compared to their baseline on the main shelf.

Inventory and Stock KPIs
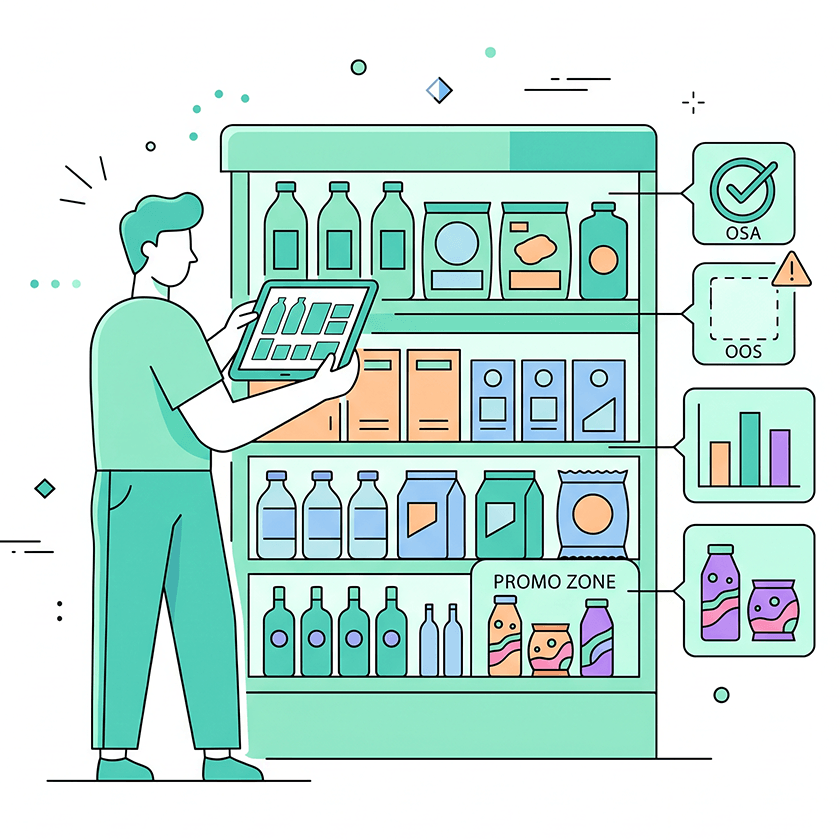
- On-shelf availability (OSA) and out-of-stock (OOS) rate are among the most commercially significant metrics in retail. An empty shelf does not just lose one sale — it trains shoppers to look elsewhere.
- Stock turnover and days of supply indicate whether inventory is being managed efficiently relative to demand.
- Sell-through rate is especially relevant for seasonal or fashion categories, where unsold stock at end-of-season means markdowns and margin erosion.

Customer Experience KPIs
- Net Promoter Score (NPS) and customer satisfaction scores provide a view of how shoppers perceive their overall experience, including navigation ease and product findability.
- Engagement rate with visual elements can be measured through dwell time or interaction tracking. These metrics matter more in some categories than others, but for premium and lifestyle brands, they are often directly correlated with retention.

Operational Efficiency and Sustainability KPIs
- Workflow efficiency measures how much time field teams spend on reporting, auditing, and administration versus active merchandising.
- Operational execution cost per store visit tracks whether the cost of maintaining execution standards is sustainable.
- Fixture and material reuse rate is gaining relevance as sustainability criteria become part of retail partnerships.
Merchandising KPIs That Truly Drive Sales and Margin
The following three groups have the clearest connection to commercial outcomes.

Core Sales Performance KPIs
The core sales KPIs are revenue growth tied to specific execution changes, gross margin by category and zone, sales per linear meter, sales per facing, and ATV. These are the numbers C-suite stakeholders read. If merchandising teams cannot connect their work to these figures, it becomes hard to demonstrate the value of what they do.
Planogram and Shelf Execution KPIs That Correlate with Sell-Out
Planogram compliance, when measured consistently and objectively, is one of the strongest predictors of sell-out performance. Studies across multiple FMCG categories and retail audits by NielsenIQ show that compliance gaps such as wrong facings, misplaced products, and missing items directly reduce sales.
OSA and OOS rates are equally critical: a product sitting in the warehouse but not on the shelf does not sell. Share of shelf matters for competitive positioning and is often directly tied to market share. Promo-zone compliance and sales lift show whether promotional investments are being executed as planned and delivering the expected return.

Traffic and Conversion KPIs That Reveal Layout and Display Impact
Conversion rate by display and by zone reveals which execution decisions are working. A display with strong stopping power but low conversion suggests the product or price point is misaligned.
High dwell time with low conversion may indicate confusing information or a weak call-to-action. These signals are actionable because they tell teams what to change, not just whether something is wrong.
Vanity Metrics and the Illusion of Control in Merchandising
Not all metrics that get reported are worth tracking. Some create the appearance of control without providing anything useful to act on. This section covers the most common ones.

Activity Metrics without Outcome: Visits, Photos and Forms
One of the most common mistakes in merchandising is measuring activity instead of results. Store visits per week, photos submitted, forms completed — these are inputs, not outcomes. A merchandiser who visits 12 stores a day and photographs every shelf is not necessarily improving anything. If those photos are never reviewed or acted on, the activity generates data but no value.

Over-Engineered Checklists and Compliance Percentages
The “98% compliance” report is common on merchandising dashboards and also one of the most misleading metrics in the industry. A score this high usually means the checklist is not measuring what actually matters. When every item on a form is weighted equally, a missing price label and a completely wrong planogram both count as one non-compliance. The score looks good. The shelf does not.
Overly detailed checklists also create a documentation burden that pulls field teams away from actual execution. A merchandiser filling in 40-item forms on every store visit spends more time proving they looked at problems than fixing them.

Tracking Everything and Prioritizing Nothing
When a team monitors 30+ indicators at once, the practical result is that nothing is truly monitored. Attention is spread equally across all metrics, which means it is concentrated on none of them. Teams know what is being measured but not what matters. They can produce reports but cannot tell a commercial director which three things they would fix first.
A simple test: if a metric does not change how a team makes decisions, it is probably a vanity metric. The question to ask about every KPI is not “can we measure this?” but “would we act differently if this number moved?”
Examples of KPIs for Different Merchandising Roles
Different roles in merchandising are responsible for different outcomes, so their KPIs should reflect that. Here is how the core metrics break down by role.

KPIs for a Field Merchandiser
A field merchandiser’s KPIs should reflect the quality of the work they complete, not just whether they showed up. The core metrics are planogram compliance rate per visit, share of shelf for key SKUs, OSA/OOS rate at the time of visit, and speed of correcting identified deviations.
For example, during a promotional campaign launch, a field merchandiser might be measured on how quickly promotional materials are correctly placed and whether OOS items are flagged for replenishment within the same day.

KPIs for a Merchandising Manager
A merchandising manager is responsible for performance across a store network. The key metrics are the share of stores meeting target shelf KPIs such as share of shelf and OSA, the impact of merchandising initiatives on sell-out, execution speed for new planogram rollouts, and pilot project results.
For example, if a new shelf concept was tested in 30 stores, the manager should be able to report its commercial result, not just whether it was executed on time.

KPIs for a Visual Merchandiser
Visual merchandisers work where brand standards meet commercial productivity, balancing shopper engagement with floor-space profitability. The most relevant KPIs are sales per display or fixture, sales lift for concept changes, dwell time and stopping power in key zones, visual compliance, and refresh frequency.
For example, when a new seasonal collection is introduced, the key question is not whether the floor set is done but whether the new presentation is converting at a higher rate than the previous one.

KPIs for an Apparel Merchandiser
Apparel merchandising comes with the added pressure of seasonality and markdown risk. The priority KPIs are sell-through rate by collection and size curve, sales per square meter and per fixture, size availability, markdown ratio, and stock turnover.
For example, a mid-season review should show which lines are tracking below sell-through targets early enough to act on them, whether through promotions, visual repositioning, or replenishment adjustments.
Methods for Assessing Merchandising Effectiveness and KPIs
Tracking the right KPIs is only part of the equation. The other part is choosing the right methods to collect and analyze the data behind them. Let’s look at the main approaches.

POS and Sales Data Analysis
POS data is the most direct measure of commercial outcome. Revenue, gross margin, basket composition, and sell-through can all be linked to execution decisions, such as planogram changes, promotional periods, or display resets.
The limitation is that POS data explains what happened but not always why. A drop in sales could reflect an OOS issue, a competitor promotion, or a planogram execution failure. Additional execution data is needed to interpret it accurately.
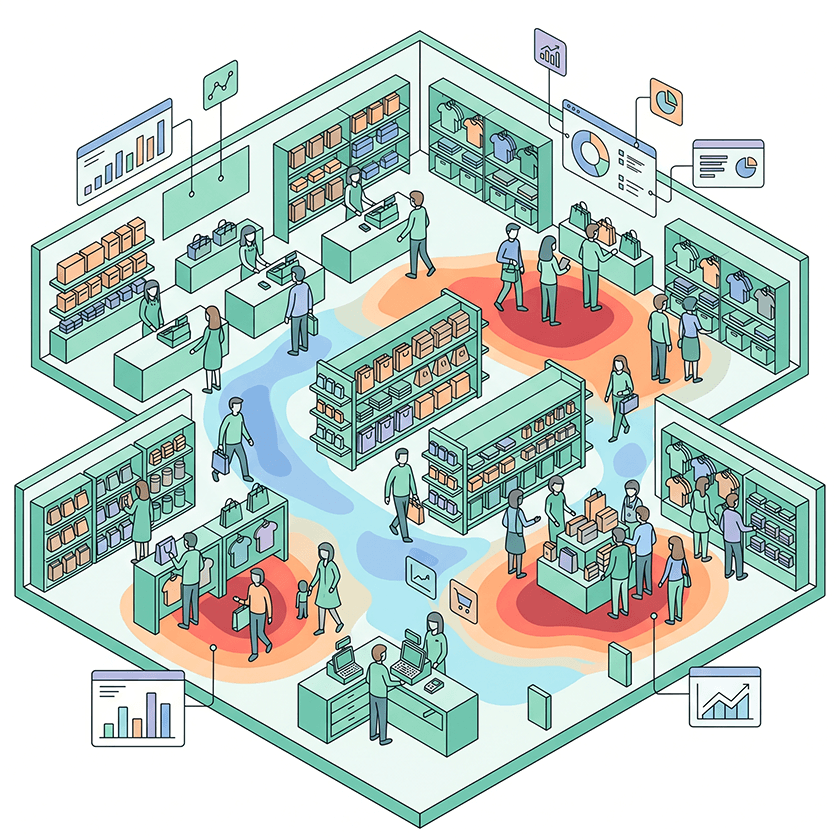
Traffic, Heatmaps and Shopper Behavior Analytics
Shopper behavior data such as foot traffic counts, heatmaps, dwell time, and stopping power adds a layer of explanation that POS data cannot provide on its own. It shows how shoppers are moving through the store and whether they are engaging with specific zones and displays.
These tools are particularly valuable for evaluating layout changes and new fixture concepts before they are rolled out across a network.

Visual Audits and Photo-Based Compliance Checks
Traditional in-store audits and photo reports remain common, but they have real limitations. They are time-consuming, prone to human error, and typically produce data that is days or weeks old by the time it reaches the people who need to act on it.
For example, a merchandiser photographs hundreds of SKUs across multiple stores in a day, a supervisor reviews a fraction of those images, and exceptions are flagged the following week. By then, the promotional window may be over.
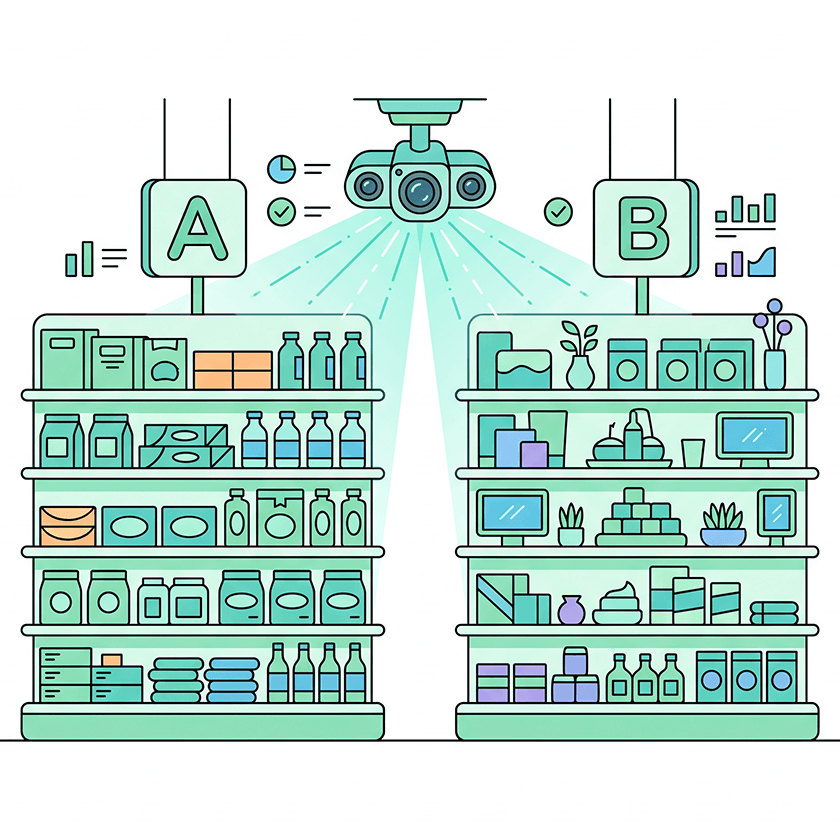
Experiments and A/B Testing in Merchandising
Controlled experiments remain one of the most reliable methods for assessing what works. A new display concept can be tested in a selected group of stores while a control group maintains the existing layout. Comparing KPIs between the two groups, such as conversion rate, sales per facing, and dwell time, gives a clear picture of the concept’s impact.
The challenge is execution consistency, since A/B tests in retail require tight control of variables that are often difficult to standardize across stores. Computer vision helps by providing objective compliance verification for both test and control conditions.

Computer Vision and Automated Shelf Analytics
Computer vision changes how shelf data is collected. Instead of relying on field teams to photograph and evaluate shelves manually, algorithms analyze shelf photos automatically, identifying products at the SKU level, detecting OOS positions, calculating share of shelf, and comparing actual layouts against planogram standards.
The data this produces is consistent, scalable, and fast. Results are available within minutes of a photo being uploaded, not days. For FMCG manufacturers and distributors tracking hundreds of SKUs across large store networks, this is the most practical way to maintain real-time shelf intelligence. Goods Checker is one example of how this approach works in practice
How Technology and Goods Checker Transform Merchandising KPI Tracking
Most KPI systems break down not because of the wrong metrics but because of the wrong data. Manual audits are slow, inconsistent, and impossible to scale. Automation changes that.

From Manual Audits to Real-Time Shelf and Display KPIs
Automated shelf analytics change not just the speed of data collection but what becomes measurable at all. Metrics like planogram compliance across a full store network, daily OSA tracking by SKU, or deviation correction speed are simply not practical to maintain through manual processes. Automation makes them routine.
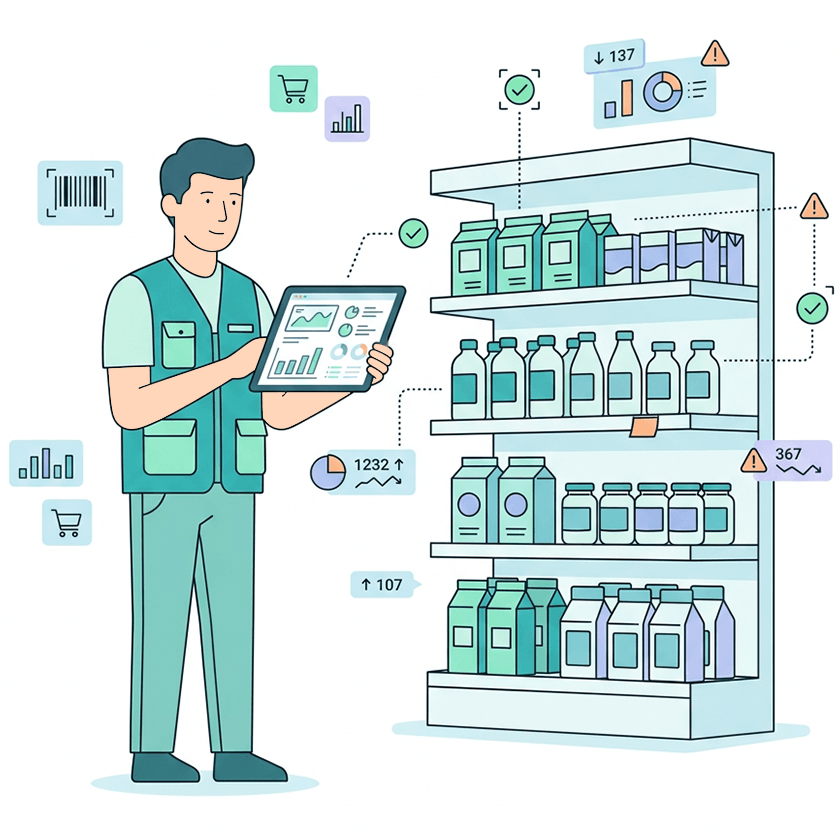
Using Goods Checker to Track Execution KPIs at Scale
Platforms like Goods Checker connect shelf execution data directly to KPI reporting workflows, reducing the delay between store visits and commercial analysis. They track planogram compliance, SKU-level availability and OOS, secondary display count and quality, and deviation correction speed across all locations in one place, updated after every store visit. Field teams spend less time on reporting and more time correcting what the data flags.

Connecting Shelf KPIs with Sales and Campaign Performance
Execution data becomes most valuable when it is linked to commercial outcomes. When shelf KPIs are tracked consistently and automatically, it becomes possible to correlate them with POS data and see the actual impact of execution quality on sales. If compliance drops during a promotional period, the revenue effect is visible immediately rather than explained weeks later in a post-campaign review.
Building a Practical Merchandising KPI System (Without the Noise)

The goal is to measure what changes decisions.
A working KPI system has three levels.
- At the executive level, the focus is on outcome metrics such as revenue impact, gross margin, sell-through rate, and OSA.
- At the management level, the focus shifts to execution metrics such as planogram compliance across the network, SOS for strategic SKUs, OOS rate, and time-to-execution for rollouts.
- At the field level, merchandisers track compliance per visit, OOS found and flagged, and deviation correction speed.
Execution KPIs like compliance and OSA should be explicitly linked to sales and margin outcomes. If that link is not visible, the system is producing information but not insight.
KPI sets should be reviewed at least once a year. As automated shelf analytics become more common, some manual metrics will become redundant and more granular signals will take their place.
Measure What Changes Shelves and P&L, Not Just Reports
The divide between useful and illusory KPIs comes down to one question: does this metric lead to action that improves a commercial outcome?
Metrics connected to sell-out, revenue risk, and market share belong in a working KPI system. Metrics that are not connected to any of these consume time without creating value.
A strong KPI system is built around sales, gross margin, shelf execution, and customer experience. It connects field-level data to executive-level decisions and requires tools capable of producing objective, timely data at scale. Without in-store analytics and computer vision, sustaining that system across hundreds of locations is not a process problem. It is simply not possible.
FAQ: Merchandising KPIs and Retail Performance Metrics
What are the most important retail merchandising KPIs?
The highest-priority KPIs are those directly connected to sales and margin: on-shelf availability (OSA), out-of-stock rate, planogram compliance, share of shelf (SOS), and sales per facing or per linear meter. These execution metrics have the clearest documented link to commercial outcomes.
What are good KPIs for a merchandiser and a merchandising manager?
A field merchandiser should track planogram compliance per visit, OOS rate, and speed of deviation correction. A merchandising manager should track network-level compliance rates, the sell-out impact of execution initiatives, and time-to-implementation for planogram rollouts.
What are examples of KPIs in merchandising and visual merchandising?
Merchandising KPI examples include OSA rate, planogram compliance score, SOS per SKU, and sales per display. Visual merchandising KPI examples include sales lift by display concept, dwell time by zone, stopping power, and visual compliance rate against brand standards.
How do you assess merchandising effectiveness in practice?
Effective assessment combines POS data analysis (to measure commercial outcomes), traffic and behavior analytics (to understand shopper response), and shelf execution data (to verify compliance). The most objective and scalable approach uses computer vision to automate shelf analysis and planogram compliance checking.
How can technology and computer vision improve merchandising KPIs?
Computer vision eliminates the subjectivity and delay of manual photo audits. It enables consistent SKU-level recognition across large store networks, automatic comparison against planogram standards, and near real-time OOS detection. This makes execution KPIs — compliance, OSA, SOS — measurable at the frequency and scale that drive genuine business decisions rather than periodic reporting exercises.