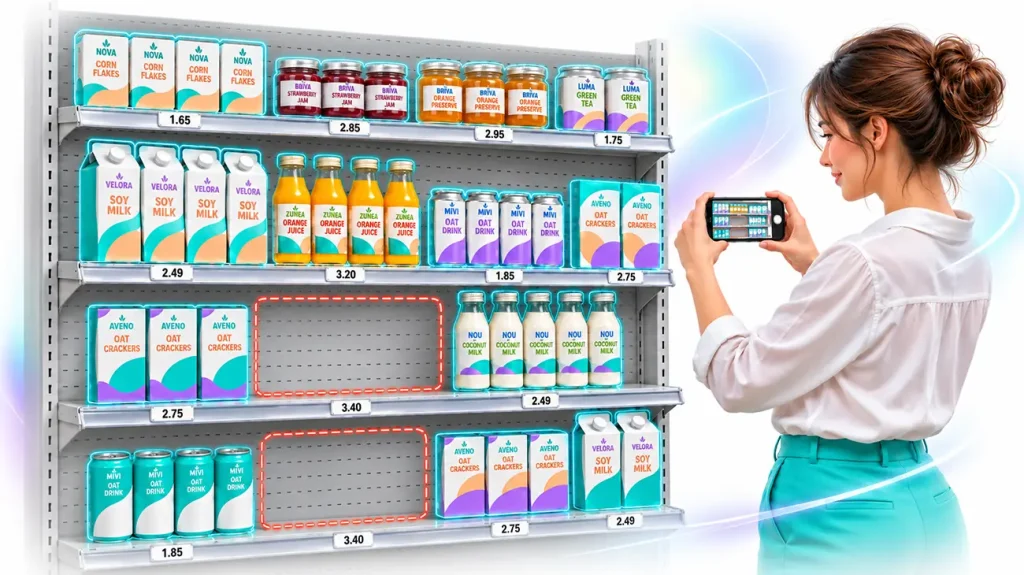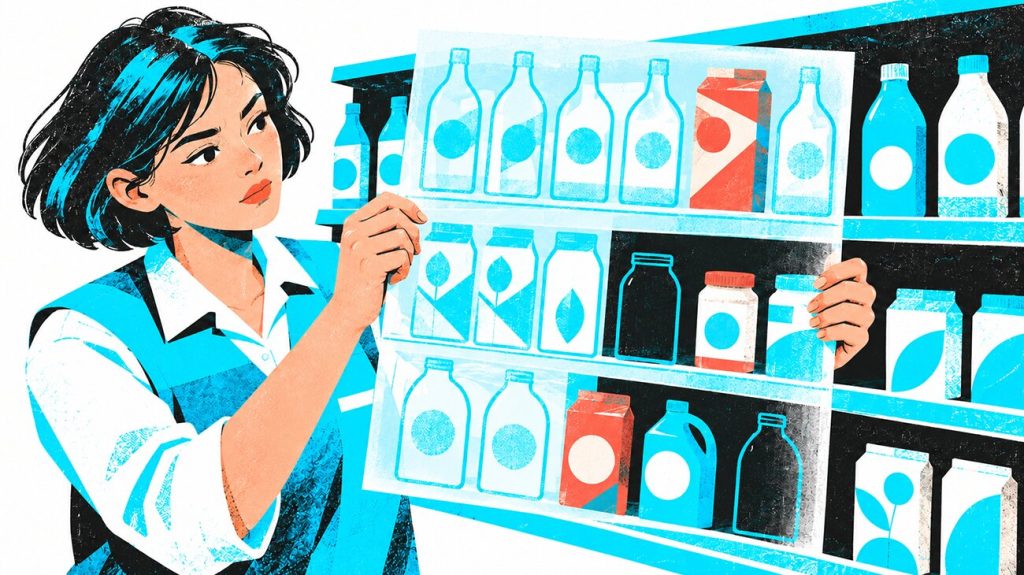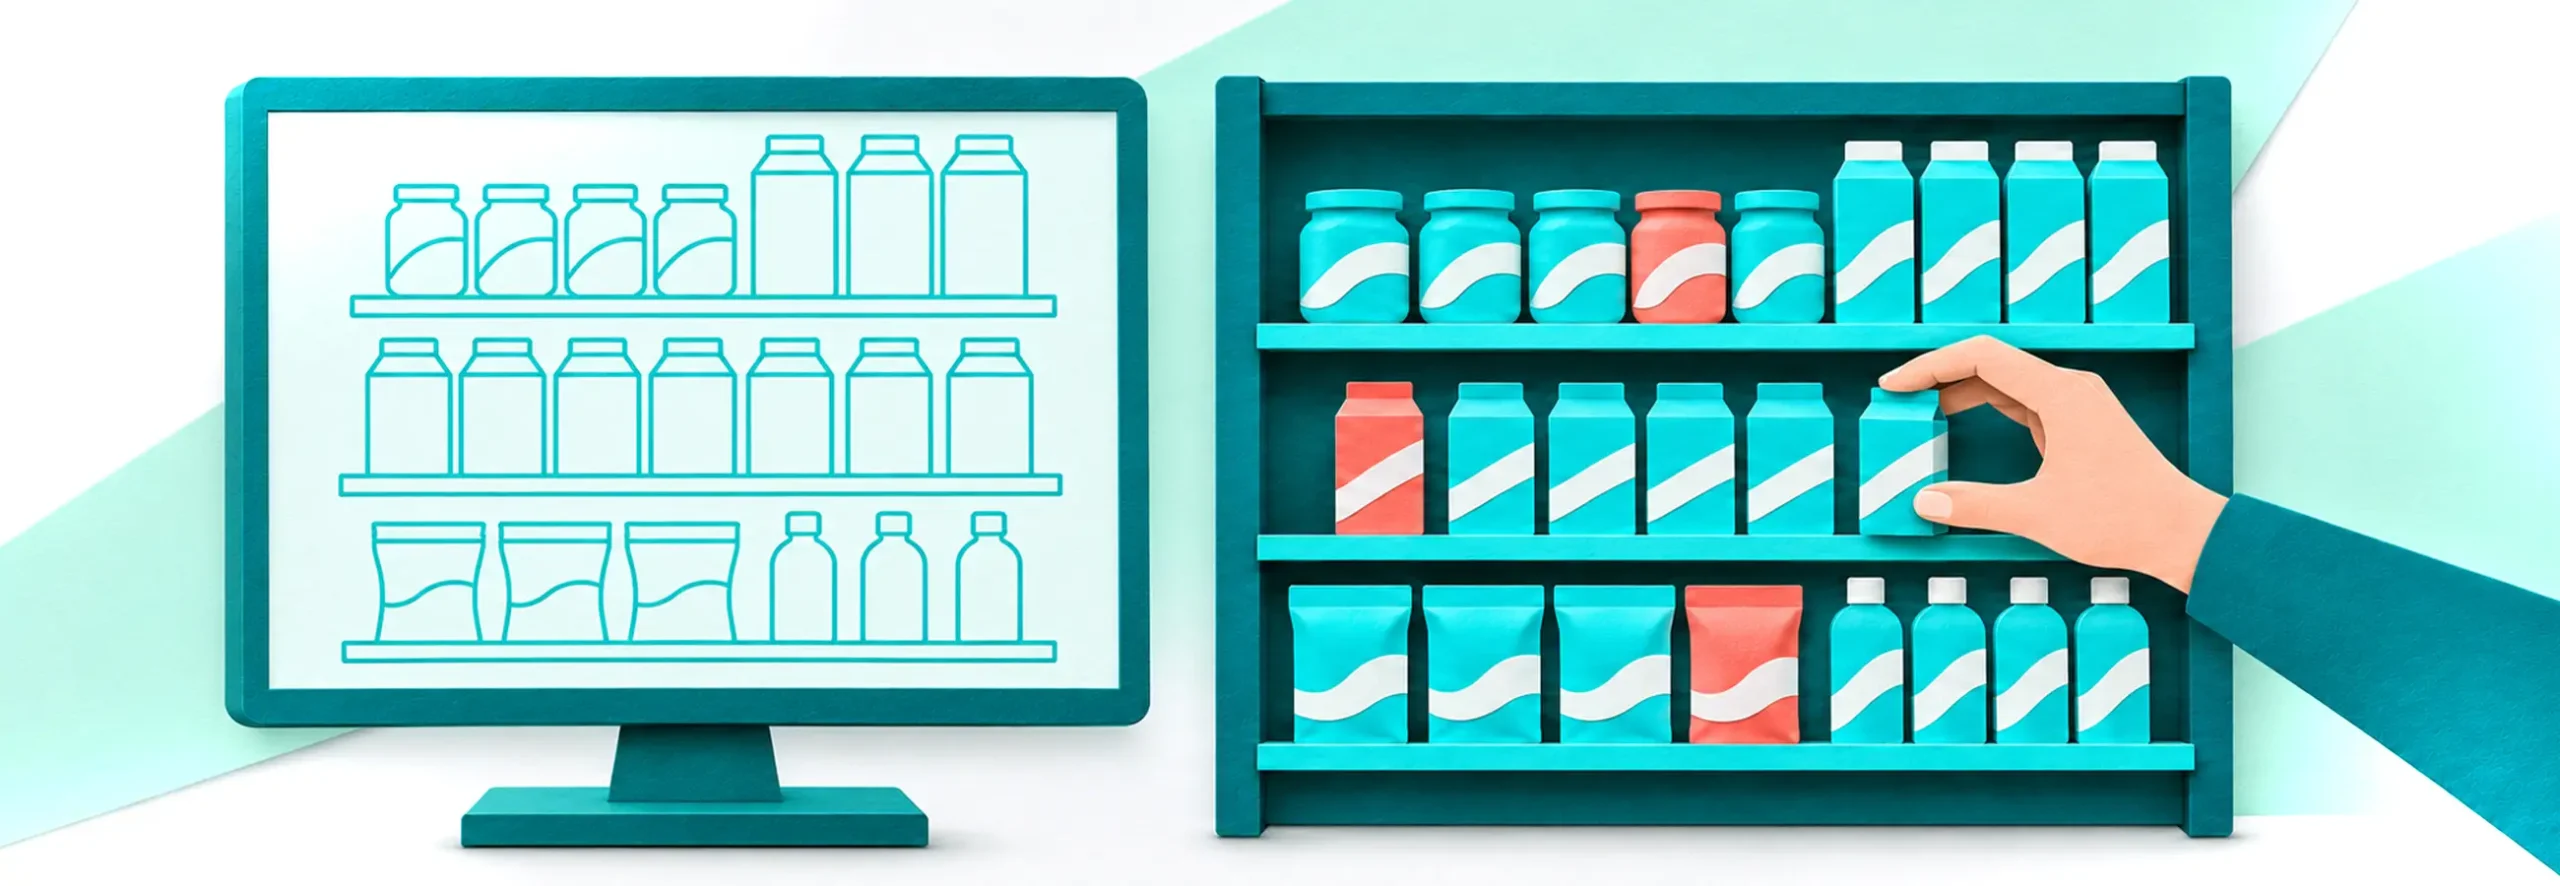

Your merchandiser has completed the visit, the store manager has signed the checklist, and the shelf looks full. Yet three SKUs are on the wrong shelf, a priority product has two facings instead of four, and a competitor occupies the remaining space. A full shelf and a compliant shelf are not the same thing. Planogram compliance measures whether the display matches the approved layout — not just whether products are available.
If you need the basics, such as what a planogram is, how to read one and which types exist, start with our guide to planograms.
This article assumes that you already have planograms and explains how to check whether stores follow them. It covers the formula for the planogram compliance rate, a benchmark scale, the reasons your score may stall, and the software functions you need to raise it above 90%.
Table of Content:
- Key Takeaways
- What Planogram Compliance Means (and What It Doesn't)
- What a Planogram Compliance Score Is Made Of
- How to Calculate Planogram Compliance Rate
- What Is a Good Planogram Compliance Rate?
- Why Planogram Compliance Can Stall Around 85%
- How to Measure Planogram Compliance: Three Methods Compared
- Planogram Compliance Software: What to Look For
- The Full Cycle: From Planogram to Verified Shelf
- A 90-Day Plan to Get Past 90%
- The Business Case: What Compliance Is Worth
- Frequently Asked Questions
Key Takeaways

- A full shelf may not match the planogram, so on-shelf availability and planogram compliance need separate measurement.
- The counting method changes the reported score, so a team needs one fixed set of rules and weights before it sets a target.
- Automated measurement needs a structured planogram. Fast feedback helps your team correct deviations, but reaching 90% also depends on stock availability and the ability to fix the shelf.
What Planogram Compliance Means (and What It Doesn't)
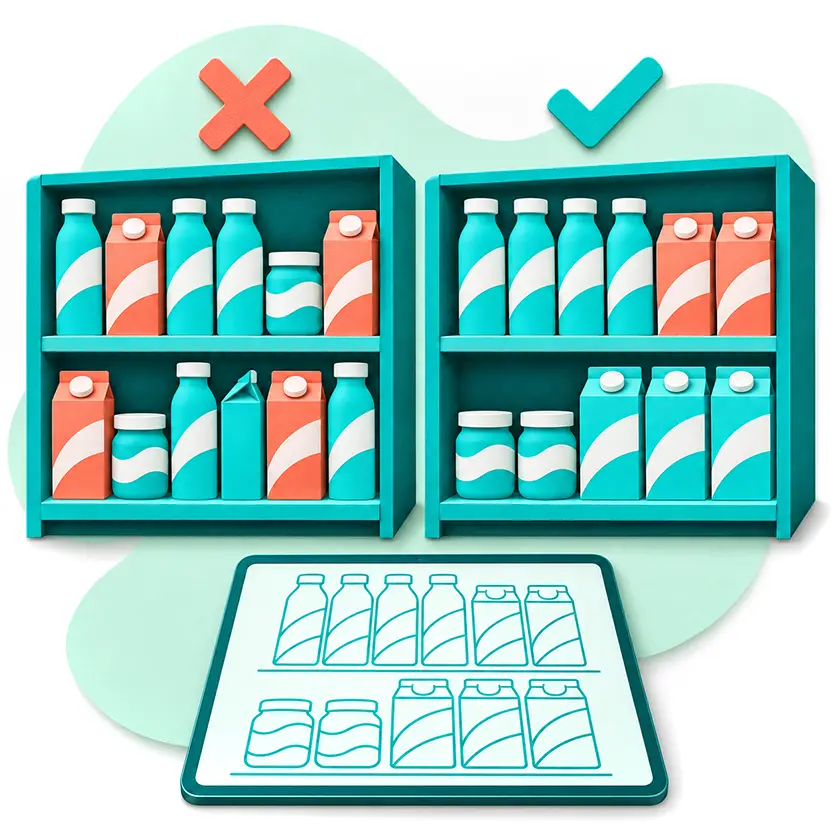
Planogram compliance is the degree to which the actual shelf in a specific store, at a specific moment, matches the approved planogram. Teams express it as a percentage. Reports often use the word compliance for three other metrics as well, although each of them measures something else.
Compliance vs. On-Shelf Availability: A Full Shelf Can Still Be Wrong
On-shelf availability (OSA) shows whether the product is on the shelf. Compliance shows whether the product is in the right place, with the right number of facings and in the right order.
The two metrics can show very different results for the same shelf.A completed visit and a manager’s signature show that the visit was signed off. They do not, by themselves, prove that the shelf matches the planogram. A product has to be on the shelf before it can be in the right place, so OSA is only the first condition for compliance.
Compliance vs. Planogram Maintenance: Managing the Plan vs. Proving the Outcome
Maintenance is work on the planogram document. The category team updates planograms, keeps track of versions and prepares variants for different store formats. A company can update its planograms every quarter and still have no information about the shelves in stores, because nobody checks them between updates.
Compliance vs. Task Completion: A Signed-Off Visit Is Not Evidence
A completed visit and a manager’s signature show that the visit was signed off. They do not, by themselves, prove that the shelf matches the planogram. This is reported compliance, that is, what the field team says about the shelf. Verified compliance requires a manager or a system to compare a shelf photo with the planogram.
Reported and verified figures can differ greatly. A major tobacco manufacturer analyzed only 3% of merchandiser photos before it started using automated recognition. After that, the company analyzed 100% of photos, and compliance rose from 60% to 90%, according to the Goods Checker case study.
What a Planogram Compliance Score Is Made Of

A compliance score can combine the following seven checks. Define which checks apply to your planogram and whether price tags and promotional materials belong in the same score or in separate execution KPIs. Each rule checks one property of the shelf.
| Compliance element | What's checked | Typical failure |
|---|---|---|
|
Presence
|
The planned SKU is on the shelf
|
The planned SKU is missing, even if another product fills its space
|
|
Position
|
Correct section, shelf and height
|
The SKU is on the bottom shelf instead of the planned eye-level shelf
|
|
Facings
|
The planned number of facings
|
Two facings instead of four, with a competitor’s product in the free space
|
|
Sequence / adjacency
|
The order of SKUs and their neighbors
|
Flavors are in the wrong order
|
|
Block integrity
|
The brand block matches the approved layout
|
Another brand’s product is placed between them
|
|
Orientation
|
The front of the pack faces the shopper
|
The pack is turned sideways
|
|
Price tag & POSM
|
Required price tags and point-of-sale materials are present and correct
|
The tag shows the price from the last promo
|
Binary vs. Weighted Compliance
In a binary model, each position either matches the plan or does not. This model is simple, but it gives the same penalty for a missing priority SKU and for a pack turned sideways.
A weighted model gives more points to priority SKUs and facings than to orientation.
Companies choose different models and weights, so you cannot compare their compliance rates directly. Before you set a 90% target, write down your own rules and use them without changes in every report.
How to Calculate Planogram Compliance Rate
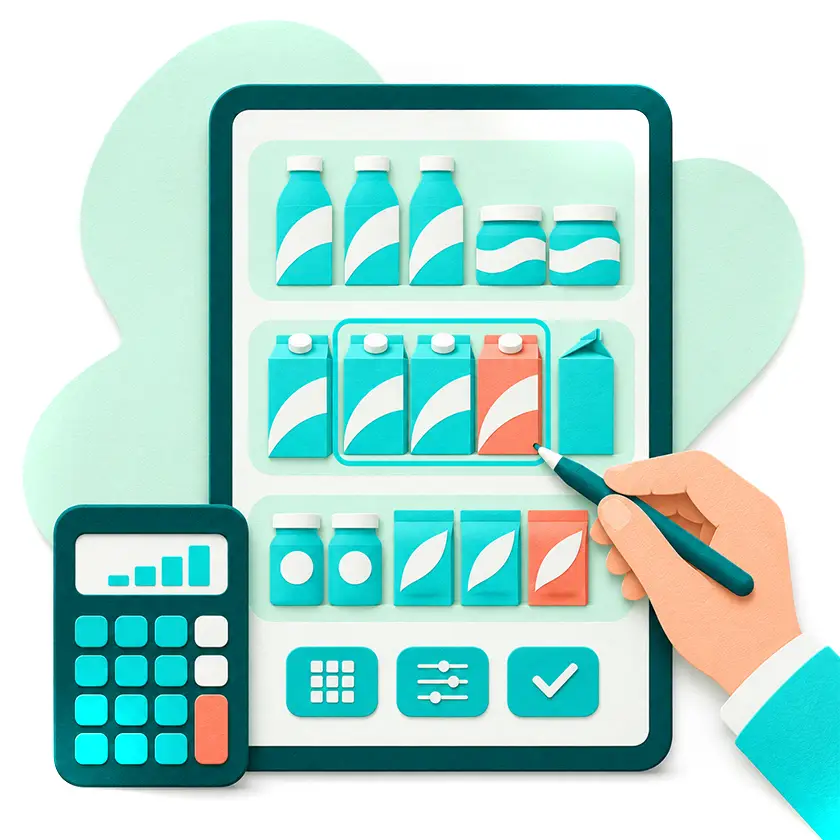
Below are two practical scoring methods. Use one consistently, and document the rules behind it. For the same shelf, the results can differ by more than ten points.
The Basic Formula
Planogram Compliance Rate (%) = (Compliant Facings ÷ Total Planned Facings) × 100
Count facings instead of SKUs. At SKU level, a SKU with half of its facings missing still counts as present. A facing counts as compliant only if it meets every rule that applies to it.
The Weighted Formula
Weighted Compliance (%) = (Achieved Rule Points ÷ Total Applicable Rule Points) × 100
For example, a team can set the following weights. A facing gets 3 points for presence, 2 for position and 1 for orientation, and facings of priority SKUs get double points. In this example, a missing facing earns zero points for all three checks, so a missing priority facing costs 12 points. A sideways regular facing loses 1 point; a sideways priority facing loses 2 because its weights are doubled. Without weights, a store can get a high score by fixing small errors and still miss the SKU that brings most of the category’s sales.
One Shelf, Three Different Scores
Take an illustrative shelf with 8 SKUs and 40 planned facings. Two SKUs are priority SKUs with 4 facings each. Priority SKU A is missing, and priority SKU B has 2 facings instead of 4. As a result, 6 of the 40 facings fail. Take an illustrative shelf with 8 SKUs and 40 planned facings. Two SKUs are priority SKUs with 4 facings each. Priority SKU A is missing, and priority SKU B has 2 facings instead of 4. As a result, 6 of the 40 facings fail. Assume that all 34 remaining facings meet every applicable rule. The weighted example uses only presence, position and orientation.
| Method | Calculation | Score |
|---|---|---|
|
SKU presence only
|
7 SKUs present ÷ 8 planned SKUs
|
87.5%
|
|
Facing-level
|
34 compliant facings ÷ 40 planned facings
|
85%
|
|
Weighted (priority facings count double)
|
216 points ÷ 288 points
|
75%
|
In the weighted model, 32 regular facings at 6 points and 8 priority facings at 12 points give 288 points. The 6 missing priority facings cost 72 points. All three rows describe the same shelf, and the score varies from 75% to 87.5% because of the method alone. Choose one method before you set any target, and use it in every report.
Reporting by Store, Category, Chain and Brand
Report the score by chain, category, region and merchandiser responsible for the result. Use these views to assign responsibility for specific corrections.
The average score for a chain does not show which stores have low results. For example, a chain with an average of 86% can have many stores above 95% and a group of stores below 60%. Also track the % of stores above threshold, that is, the share of stores with a score of 90% or higher. This planogram compliance KPI shows how many stores need corrections.
What Is a Good Planogram Compliance Rate?
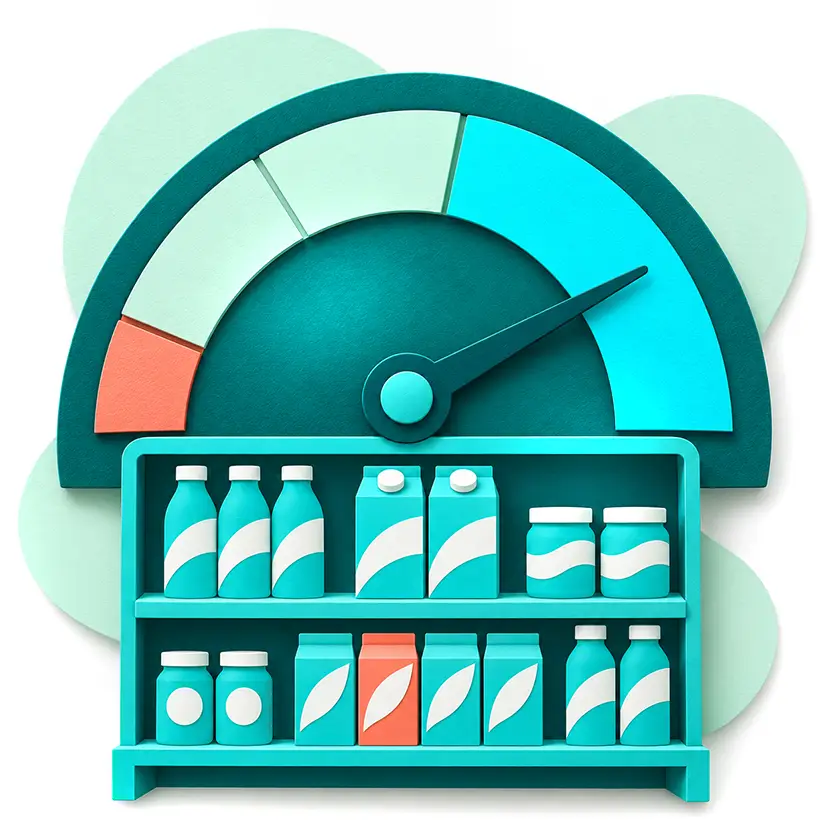
A good planogram compliance rate is 90% or higher on priority SKUs and categories, and the team keeps it at this level month after month. Most retailers have much lower results. IHL Group’s 2025 Shelf Intelligence Report surveyed executives at more than 200 large US retailers and found an average planogram accuracy of 57%. Fewer than one in four of these retailers reach 80% in key shelf metrics.Published figures provide context, but they are not directly comparable unless the scoring rules and measurement methods match.
Use the ranges below as an illustrative action guide for your own scoring model, not as universal industry benchmarks. The score shows how much of the agreed standard is met; it does not explain the cause on its own. We use five score ranges to show how a team measures compliance and how fast it sends feedback to stores.
| Compliance rate | What it means |
|---|---|
|
Below 60%
|
Check stock availability, the planogram version and major layout deviations first
|
|
60-70%
|
Identify recurring failures and assign responsibility for corrections
|
|
70-85%
|
Prioritize repeated SKU, position and facing errors
|
|
85-90%
|
Investigate the remaining gaps and verify completed fixes
|
|
90%+
|
Maintain the agreed standard and monitor priority-SKU exceptions
|
“A chain of 500 gas stations raised compliance from 50% to 90% after operators started comparing every cabinet with its planogram in the app, according to the Goods Checker case study. We do not recommend 100% as a target. Products on the shelf change every hour, and in the same gas station chain several planogram items changed every week. Before pursuing 100%, compare the cost of correcting the remaining deviations with their likely commercial impact. Keep any mandatory retailer requirements separate from your overall target, so hold 90% on priority SKUs.”

Why Planogram Compliance Can Stall Around 85%

If your score has stalled around 85%, check the following six issues. They can limit progress even when your field team follows the agreed process.
- The planogram data is not ready for automated checks. A visual layout may lack the SKU identifiers, shelf positions and facing counts the system needs. Convert or import those details into a structured format, then validate them.
- Two auditors score the same shelf differently. If the team has no single set of rules and weights, the score depends on how strict the auditor is.
- The sample is too small. When the team checks a few dozen stores out of several hundred once a month, it cannot see which stores and categories need work.
- The data arrives too late. If the manager receives the report a week after the visit, the shelf in the report no longer looks the same.
- Nobody is responsible for a specific correction. A report that shows 82% for the whole chain does not say which store has to fix which shelf today.
- The shelf changes all the time. Promotions, new layouts, seasonal products and new store staff change the shelf every week. To keep planogram adherence high, the team has to check the shelf on every visit.
Five of the six reasons relate to measurement and the speed of feedback. Merchandisers fix what the reports show them, so when reports arrive late or with mistakes, the corrections also come late.
How to Measure Planogram Compliance: Three Methods Compared
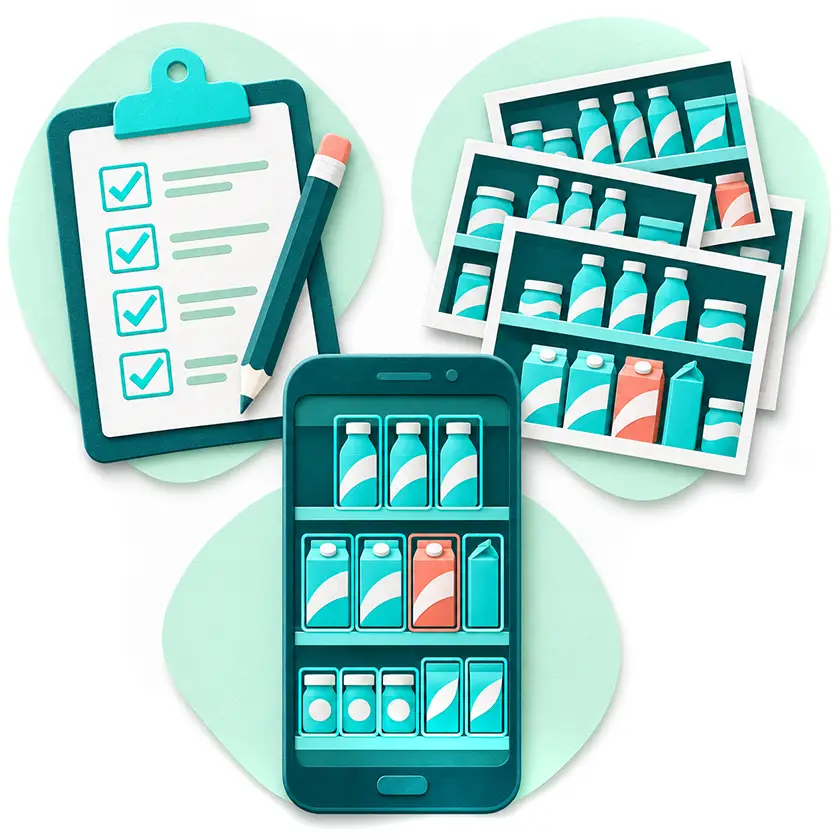
Most manufacturers still use the first two methods from the table below. In the Promotion Optimization Institute’s 2026 State of the Industry Report, based on 146 responses from consumer goods manufacturers, 81% of organizations check compliance manually or semi-manually.
| Method | Time to usable feedback | Objectivity | Coverage | Cost per store visit | Best for |
|---|---|---|---|---|---|
|
Manual checklists
|
Immediate on site; reporting time depends on the workflow
|
Low, depends on the auditor
|
A sample of stores
|
Low at the start, grows with headcount
|
Pilots and small networks
|
|
Photo audits with human review
|
Depends on reviewer capacity and queue length
|
Medium, people score the photos
|
Limited by the number of reviewers
|
Grows with each store added
|
Spot checks of key accounts
|
|
AI image recognition
|
Seconds to minutes after upload; exceptions may need review
|
High, same rules for every photo
|
Every visit with usable photos submitted
|
Lower per photo as volume grows
|
Frequent checks across larger store networks
|
Manual Checklists and Store Walks
A manual planogram compliance audit can work well for a small number of stores. Its main limitations are reviewer consistency, staff time and the ability to check every visit. Keep the checklist and supporting photos so another reviewer can verify the result.
Photo Audits with Human Review
Photo audits give the team a photo for every check. People still review these photos manually, so the results come with the same delay, and the cost grows with every new store. Reviewers also rarely have time to check every photo.
AI Image Recognition
Image recognition compares products detected in shelf photos with the digital planogram and applies your scoring rules. It can reduce routine review work, but unclear images and uncertain matches still need a review process.
Goods Checker reports 98% product recognition accuracy for Shelf Eye. Validate performance on your own packaging and store photos. GPS checks and restrictions on gallery uploads help reduce the risk of incorrect or reused photos. The app also records the GPS location of each photo and does not accept photos from the phone gallery, so managers can be sure the merchandiser took the photo in the right store.
Planogram Compliance Software: What to Look For
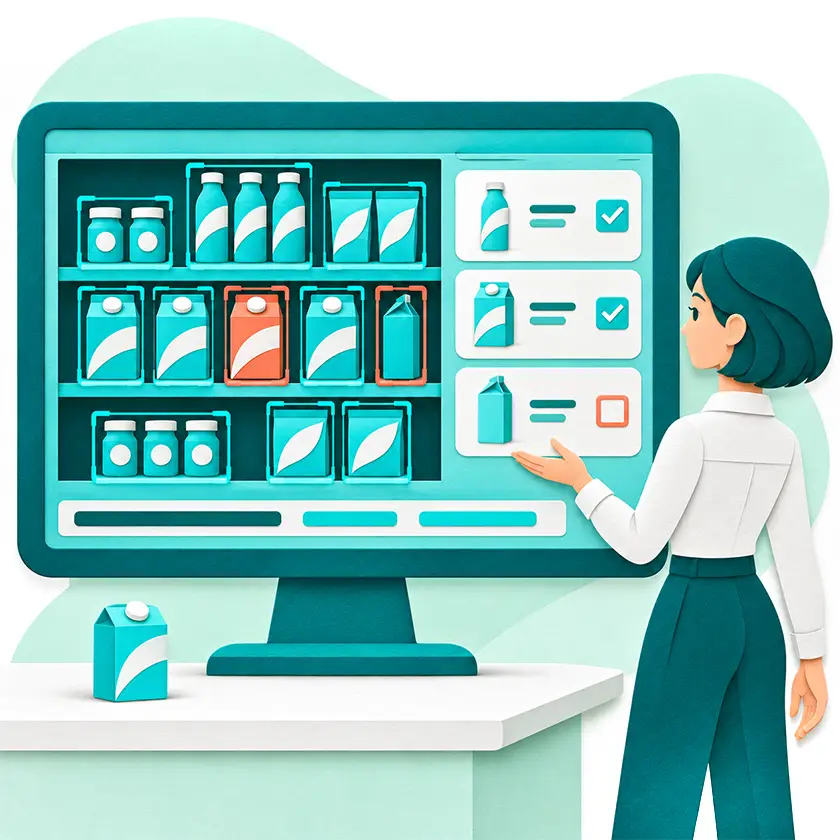
The vendors in this category offer different functions, and the questions below help you compare them.
What Planogram Compliance Software Does
Planogram compliance software recognizes products on shelf photos, compares them with a digital planogram and calculates a compliance score for every store visit. A complete system has these functions:
- SKU recognition on shelf photos and comparison with the digital planogram
- calculation of compliance and share of shelf
- detection of out-of-stocks, empty spaces and price tag errors
- automatic tasks for merchandisers
- data export to BI systems
Eight Questions to Ask Any Vendor
Use this planogram compliance checklist in your first calls with vendors.
- Can the system import or build planograms, or does it only read a static file?
- How do we define compliance rules, and can we give them different weights?
- What is the recognition accuracy for our packaging, and who updates the SKU library?
- How long does it take to calculate a score from a photo: seconds, hours or days?
- Does the system recognize competitor products and measure share of shelf for all brands?
- Does it check where and when the merchandiser took the photo?
- Does it create a task for a specific person, or only a report?
- Can we export the raw data to our BI system via API, CSV or JSON?
Why Your Planogram Format Decides Whether Automation Is Possible
Reliable automated checks need structured planogram data: SKU identifiers, shelf positions and planned facings. A picture in a slide or PDF may need to be converted and validated first. A spreadsheet can work if it contains the required fields in a consistent format that the software can import. What matters is the structure and quality of the data, not the file extension.
The Full Cycle: From Planogram to Verified Shelf
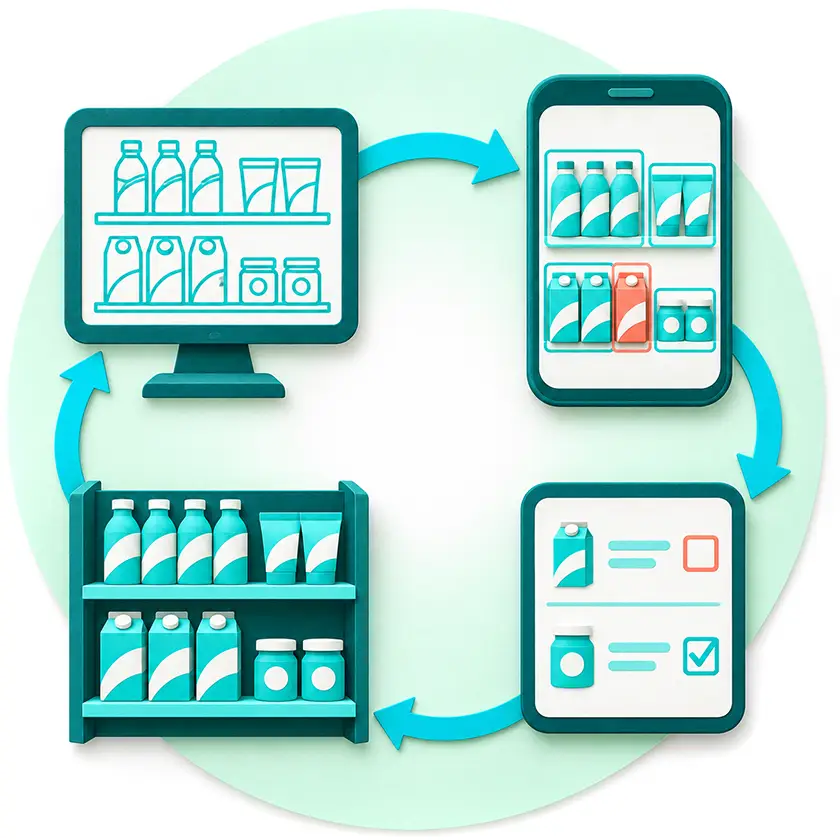
A team raises compliance above 90% when it repeats the same five steps after every visit.
Step 1. Build the planogram in a structured format. In Plano Creator, a category manager creates a 100-SKU planogram in a minute with drag-and-drop. The module finds layout errors such as overlapping products, works with catalogs of more than 4,000 items and exports planograms to PDF, PNG and MS Office.
Step 2. Send it to merchandisers. The planogram appears in the merchandiser’s app as soon as the manager saves it.
Step 3. Photograph the shelf. The merchandiser takes a photo of the shelf, and the app records the GPS location. The app can capture photos offline and upload them for processing when the connection returns.
Step 4. Compare and score. Shelf Eye recognizes each SKU, calculates compliance and measures share of shelf by brand, sub-brand and SKU, including competitors. It also finds out-of-stocks and empty spaces, reads price tags and sends the data via API or to BI systems such as Qlik or Tableau.
Step 5. Create a task for the merchandiser. The Check & Go app shows the merchandiser where the shelf differs from the planogram while the merchandiser is still in the store. It also sends the report to the manager immediately. On the next visit, the new photo shows whether the merchandiser fixed the shelf, and the cycle starts again.
A 90-Day Plan to Get Past 90%

Days 1-30. Define rules and measure the starting level. Write down your compliance rules and weights, including higher weights for priority SKUs, and count facings instead of SKUs. Convert the planograms for priority categories into a digital format, and then measure the whole network once. The first result will likely be lower than the field reports.
Days 31-60. Set up regular measurements. Measure compliance automatically on every visit, and make sure the merchandiser receives a task no later than one day after the photo. Assign a responsible person for each chain or region, and track the % of stores above threshold as your main metric.
Days 61-90. Raise the threshold. Work first with the quarter of stores that have the lowest scores, and keep the scoring rules and priority weights agreed in the first month. If you change the model, recalculate the baseline before comparing results. Compare compliance and sales for each store to see how they relate in your own data. Then raise the threshold from 85% to 90%.
By day 90, aim to have a repeatable process: measure each visit, assign corrections within one day and verify completion. Use the results to judge whether a sustained 90% target is realistic for the selected stores and categories.
The Business Case: What Compliance Is Worth
When you ask for a budget, the software capabilities to look for how much money the company loses because of poor retail execution. Below are figures from studies published in 2024-2026.
- In-store inefficiencies cost US retailers in the sectors covered by Coresight Research 6.4% of gross sales in 2026, or $196.4 billion a year, compared with 5.5% in 2025, according to Coresight’s State of In-Store Retailing 2026, a survey of 200 US retail decision-makers.
- In the same study, 86% of retailers reported spending less time on manual tasks after introducing store intelligence technology.
- Retailers that implemented Hershey’s Gold Standard Planogram for candy, mint and gum received more than $287 million in incremental category sales across 18+ retailers in the US and Canada, with an average 19% increase in dollar sales year over year, according to The Hershey Company (2024).
To estimate the value for your business, use this calculation.
Estimated annual incremental sales = Annual category sales × Compliance percentage points gained × Assumed relative sales uplift per percentage point
Take the last value from your own comparison of stores, or calculate the result with two or three values. For an illustrative category with $10 million in annual sales and an increase from 82% to 90%, a sales change of 0.1%, 0.2% or 0.3% per point gives $80,000, $160,000 or $240,000 a year.
Use 8 percentage points for an increase from 82% to 90%, and enter 0.1% as 0.001. These are illustrative scenarios, not forecasts. To estimate net benefit, apply the contribution margin and subtract software, implementation and additional operating costs.
Frequently Asked Questions
What is planogram compliance?
Planogram compliance is the degree to which the actual shelf in a store matches the approved planogram at a given moment. Teams measure it as the share of planned facings that meet the rules for presence, position, facings, sequence, orientation and price tags.
How do you calculate planogram compliance rate?
Divide the number of compliant facings by the total number of planned facings and multiply by 100. A facing counts as compliant only if it meets every rule that applies to it. In the weighted version, priority SKUs get more points than minor rules such as orientation.
What is a good planogram compliance rate?
A 90% target can be useful for priority SKUs and categories when the scoring rules are clearly defined. It is not a universal benchmark. Compare results only when the measurement method, planogram scope and audit timing are consistent, and track critical failures separately from the overall score.
What's the difference between planogram compliance and on-shelf availability?
On-shelf availability shows whether a product is on the shelf. Compliance shows whether the product is in the right place, with the right number of facings, in the right order and with the right price tag. A full shelf is not always a compliant shelf, so OSA can be 100% while compliance is much lower.
How often should planogram compliance be checked?
Check priority shelves on each merchandiser visit and after major planogram or promotion changes. Set the frequency according to shelf turnover and the cost of missed deviations. Record when each check took place: a high score from last month does not describe the shelf today.
How often should planogram compliance be checked?
Can you measure planogram compliance without special software?
Yes. Use a current planogram, a consistent checklist and shelf photos to calculate the score manually. This can work for pilots and small networks. As visit volume grows, review time and scoring consistency become harder to manage, making automation more useful.