
At retail conferences over the past three or four years, technology vendors would regularly take the stage and show cameras reading every SKU on a shelf in real time, robots restocking overnight and dashboards that guided field teams before they even arrived at the store. Almost none of it made it into daily operations.
By 2026, things look different. Some of those use cases have turned into tools that deliver measurable results in OSA rates, planogram compliance and audit turnaround. Many others are roughly where they were three years ago.
If you are an FMCG manufacturer, distributor or retail chain investing in AI right now, knowing which category a given tool falls into has a direct impact on your budget and your results. This article covers where AI in merchandising is delivering business value and where it is still hype.
Table of Contents
- What Do We Really Mean by "AI in Merchandising" in 2026?
- Where AI Is Already Delivering Real Value in Merchandising
- KPI-Driven AI Recommendations vs. "Smart Merchandising" Buzzwords
- Realograms and IR-Based Shelf Execution Control in Practice
- Real-World Use Cases: What's Working for Retailers and Suppliers
- Where AI in Merchandising Is Still Mostly Hype
- How to Evaluate AI in Merchandising: A Practical Checklist
- How Goods Checker Uses AI and Computer Vision in Merchandising
- How to Get Started with AI in Merchandising (Without Burning Your Budget)
- AI as a Lever for Merchandising Efficiency, Not a Magic Wand
What Do We Really Mean by "AI in Merchandising" in 2026?

“AI in merchandising” is a broad term. It covers image recognition algorithms scanning shelf photos, machine learning models finding patterns in sales data, and a range of other technologies.
One of the most proven technologies for in-store execution is computer vision. The focus is physical retail such as grocery, convenience, pharmacy and general trade where shelf conditions have a direct impact on sales.
E-commerce recommendation engines have been working well for years, but the physical shelf is a harder problem to solve. Lighting conditions change, photo angles vary and fixing an issue on the ground takes hours rather than seconds.
Today AI in merchandising means automated shelf monitoring, planogram compliance verification, OSA and OOS detection, price tag verification and task prioritization for field teams. These are the areas where enough real deployments exist to measure and compare results.
Where AI Is Already Delivering Real Value in Merchandising

Companies scale what works. Here are the areas where businesses are already seeing measurable results.
Computer Vision for Shelf Analytics, OSA and Planogram Compliance
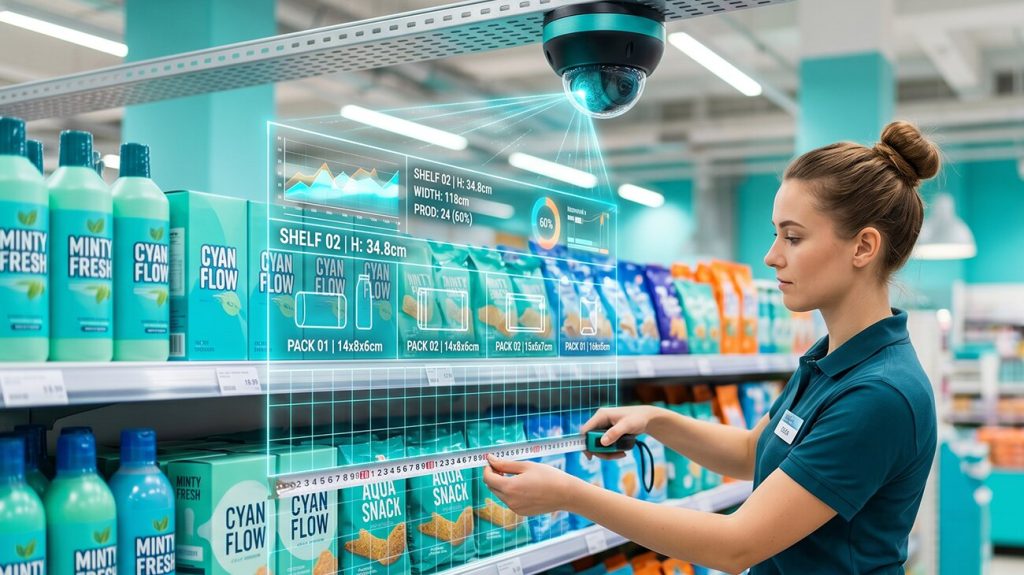
In any store, the shelf rarely looks exactly as planned. Products end up in the wrong places, facings are off, gaps appear. Photo-based shelf compliance monitoring is developed to find these issues systematically.
A merchandiser photographs a shelf section using a mobile app and the image is processed within seconds. The system identifies every visible SKU, checks placement against the planogram and flags any issues. The planogram defines what the shelf should look like and the realogram built from the photo shows what it actually looks like. Most merchandising value leaks in that gap. A product placed in the wrong section, blocked by a competitor’s display material or simply out of stock is effectively invisible to the shopper.
OSA and OOS detection come out of the same process. With computer vision empty slots are flagged automatically without the merchandiser manually counting facings or filling in a form. Moving from periodic manual audits to systematic photo-based monitoring means problems get found and fixed significantly faster.
Shelf share by brand and category is another output of the same data. Instead of relying on negotiated agreements or periodic surveys, suppliers can see their actual facing share across the network on any given day.
Photo-Based Price Tag Verification and Promo Execution Checks
Pricing errors and missing promo materials are easy to overlook. A product on promotion but showing the wrong shelf price loses the sale — and nobody finds out until the numbers come in at the end of the week.
Photo-based price tag verification handles the check automatically. The system reads the price tag from the photo and flags any mismatch with the current price list or active promotion. The same works for POSM. If a display is missing or in the wrong spot, it shows up immediately.
Finding errors faster means fixing them faster. In categories where price drives the purchase decision, that gap in time has a real cost.
AI-Powered Shelf Analytics for Merchandising Efficiency
Compliance checking tells you whether the shelf looks right. Shelf analytics goes further and asks what shelf conditions actually drive sales.
Which positions within a category sell faster? How does facing count on a key SKU affect sell-through across different store formats? Traditionally, teams answered these questions with small samples and intuition. Collecting shelf data systematically across a large network lets machine learning find patterns that no one would spot manually.
Category managers and trade teams can see what is happening on the shelf and how it connects to actual sales, instead of guessing what happened in the store.
KPI-Driven AI Recommendations vs. "Smart Merchandising" Buzzwords

“Smart merchandising” is a label that gets attached to a lot of different tools. Not all of them deliver actual business results.
Smart Merchandising Recommendations Grounded in Real KPI Data
A system that actually works connects every recommended action to a measurable KPI. It takes shelf data, sales data and compliance history and hands field teams a prioritized list of actions ranked by impact on KPIs, for example, OSA, OOS rate, shelf share, or expected off-take uplift.
For field teams this means knowing where to go first. Instead of a list of 40 stores with no guidance, they get a shortlist of five where OOS or compliance issues are most likely cutting into sales.
Off-the-Shelf AI That Ignores Your KPIs: Why It Often Fails
Some platforms generate recommendations that sound specific but have nothing to do with the actual business problem. For example, the system can suggest increasing facings on a given SKU across all stores in a region. Without sell-through data for that specific format, category and price point, it is generic advice with an AI label on it.
The problem with ignoring KPIs is that nobody can tell when the AI is right. Without a connection to OSA, shelf share or off-take, teams have no basis for prioritization and no way to know if anything they did actually worked.
Realograms and IR-Based Shelf Execution Control in Practice

Most companies have planograms. But fewer have a clear picture of how closely their shelves actually match them.
From Planogram to Realogram: Seeing the Shelf as It Is
A realogram is a photo-based record of the shelf as it actually looks at any point in time. Compared against the planogram, it shows where execution goes wrong: which products are misplaced, which slots are empty, which facings are off.
The execution gap has always existed. What changed is the ability to measure it quickly and at scale. Where a manual audit of one shelf section used to take 20 to 30 minutes, a photo taken on a mobile app does the same job in 30 seconds.
Photo-Based Shelf Compliance and OSA/OOS Monitoring
The merchandiser photographs the shelf using the mobile app. The recognition engine identifies each SKU with accuracy above 95 percent, spots empty slots and misplaced products, and checks the result against the current planogram. Within seconds the app shows compliance status and any flagged issues.
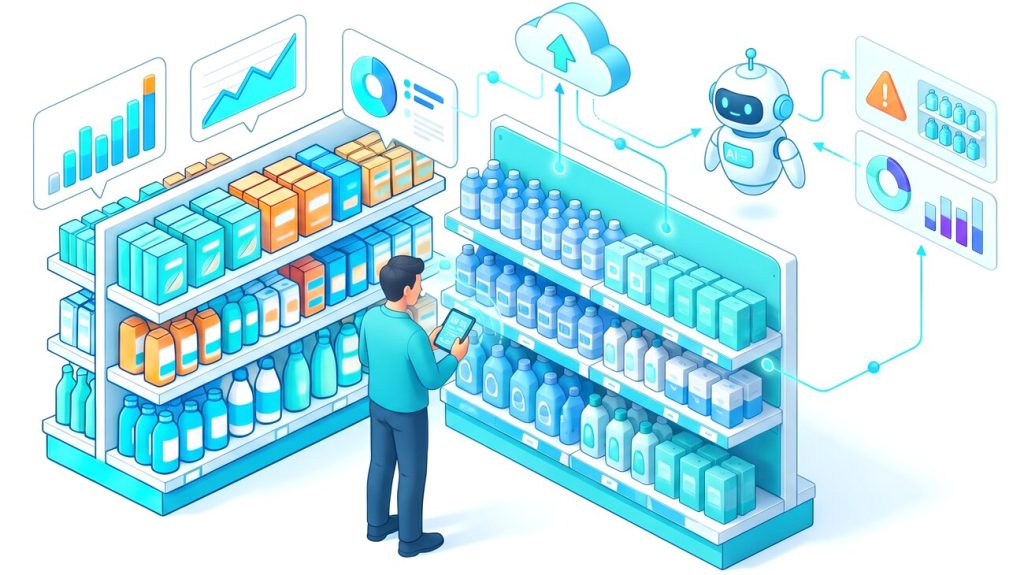
That data goes straight into the analytics dashboard: planogram compliance score, OSA rate, OOS count, shelf share by brand — all updated in real time after each visit. Managers and category teams see the current state of the network without waiting for anyone to file a report.
For suppliers working across multiple retail chains, this matters. For the first time at scale, both sides of the conversation have access to the same factual, continuously updated record of shelf execution across thousands of outlets. Disputes about what is actually on the shelf become much harder to sustain.
Real-World Use Cases: What's Working for Retailers and Suppliers

The cases below show how retailers and suppliers are using AI-based shelf monitoring today and what it is actually delivering.
Faster Rollout of Merchandising Standards Across Thousands of Stores
When planogram standards get updated, the key question is how fast those changes actually reach the shelf. Earlier it took weeks. With photo-based shelf compliance monitoring, every store visit includes an automatic compliance check against the updated standard. Deviations show up on the dashboard the same day. Teams can spot consistently non-compliant stores before they become a bigger problem.
One merchandising agency in Eastern Europe working with Goods Checker across 45 retail chains and nearly 700 outlets reduced reporting time per store visit from approximately one hour to around 20 minutes. The audit process also became faster by 10 to 50 percent depending on store size. That time saving translated directly into the ability to cover more stores per day without adding headcount.
Transparent Shelf Execution for Suppliers and Retailers
Disputes about shelf execution between suppliers and retail chains are common. The supplier says the product is not on display as agreed. The retailer disagrees. Without shared data, the conversation goes nowhere.
Shared dashboards change that. Both sides look at the same numbers from the same photos. Disagreements do not disappear, but they shift from “whose version of reality do we trust” to “what do we do about this specific store this week.”
One distributor working with Goods Checker faced exactly this situation. The company managed display agreements across multiple retail chains but had no reliable way to verify whether its premium chocolate range was actually placed according to the planogram. After a three-month pilot across 80 outlets, planogram compliance improved from 60 to 90 percent. Managers gained a transparent monitoring system and were able to address non-compliance with retailers using documented photo evidence rather than field reports.
Measurable Uplift in Off-Take and Reduced Manual Audit Costs
The business case for AI-based shelf monitoring comes down to two things: cutting costs and protecting revenue.
On the cost side, when audit time drops, the same field team can cover a larger network without adding headcount. On the revenue side, the gains come from faster OOS prevention and compliance enforcement. A product out of stock for one day in a high-traffic location loses a predictable number of sales. A promotional display missing during the first week of a four-week campaign loses a disproportionate share of the promotional uplift. Systematic shelf monitoring shortens the time between a problem appearing and someone fixing it.
Where AI in Merchandising Is Still Mostly Hype

Not everything sold as AI in merchandising delivers business results. For example, some tools are hard to scale, others are not what they claim to be. Here are the areas to watch out for.
Fully Autonomous Stores and the “No-Staff” Fantasy
The fully autonomous retail store keeps showing up at conferences. No checkout staff, no merchandising team, shelves that monitor and restock themselves. In 2026, it is still mostly a conference topic.
Amazon’s cashierless stores and various robot-stocking pilots show the technology can work in controlled conditions. Running it economically across tens of thousands of grocery, convenience and general trade outlets is a different story. Infrastructure costs, irregular products and the operational burden of managing technical failures in a live store have kept these projects at the pilot stage.
For most FMCG manufacturers and retailers, the more useful question is how to get reliable data from stores that people will continue to run for the foreseeable future.
Black-Box “AI Scores” with No Link to Merchandising KPIs
Some platforms generate scores, for example, compliance scores, shelf quality scores, execution ratings, and display them on a dashboard with trend lines and color coding. It looks like a working product but those scores rarely connect to any KPI the business actually manages.
What does a shelf quality score of 73 mean for OSA? For off-take? If the answer requires a call to the vendor, the score is not actionable. It reflects the platform’s internal logic, not the business outcome anyone is trying to improve.
A score that a category manager or field supervisor cannot explain in terms of what to do next is just a number on a screen.
Generic LLM Chatbots without In-Store Data Integration
Generative AI and large language models have legitimate uses in merchandising. For example, businesses use them for drafting planogram briefs, summarizing visit reports, and answering category questions. None of that makes a chatbot an AI merchandising solution.
A chatbot with no access to shelf data, sell-out data or compliance history cannot tell you anything useful about your specific network. It can explain what OSA means but it cannot tell you that a specific store has been running at 78 percent OSA for three weeks and what to do about it.
Vendors increasingly wrap LLM interfaces around thin data layers and call the result an AI merchandising solution. The interface may look impressive. But if there is no real shelf data behind it, there is nothing actionable on the other side.
How to Evaluate AI in Merchandising: A Practical Checklist

Choosing an AI solution for merchandising gets easier when you know what questions to ask.
Start from KPIs: OSA, OOS, Shelf Share, Off-Take, Merchandising Efficiency
Before evaluating any platform, define which KPIs the solution needs to move. OSA, OOS rate, planogram compliance, shelf share, off-take on priority SKUs, and audit cost per store are the most relevant metrics to start with. Any solution that cannot show a direct connection to at least two or three of these should be treated with caution.
It is worth asking the vendor how their platform measures OSA, how it calculates planogram compliance, and how its recommendations connect to sell-out data. The answers will tell you whether you are looking at a production-ready tool or a well-presented demo.
Data Quality, Realogram Coverage and Integration with Planograms
Good output requires good input. Are photos being collected consistently across all relevant stores at the right frequency? Does the recognition engine have enough training data for your specific SKU range, including seasonal variants and new launches? Is the planogram library current and linked to master data?
The best recognition algorithm produces unreliable results if photos are poorly lit, incomplete or matched to the wrong planogram version. Picking a shelf monitoring platform means looking at the data collection process, not just the recognition capability.
Time-to-Value, Scalability and Transparency
Three more criteria are worth checking before making a decision.
- Time-to-value: how long from contract signing to first actionable data? A solution that requires six months of implementation before generating any output is a significant risk for a first deployment. Look for vendors with SaaS-based onboarding that can show results within two to four weeks.
- Scalability: does the solution perform consistently as the store network grows from dozens to hundreds to thousands of outlets? Ask for references from clients operating at the scale you are planning to reach.
- Transparency: can the system explain why it flagged a specific store or suggested a specific action? Systems that cannot explain their reasoning create adoption problems in field teams, regardless of how accurate the underlying model is.
How Goods Checker Uses AI and Computer Vision in Merchandising
Below is a closer look at how Goods Checker approaches each of these areas — from photo collection to KPI dashboards to AI-generated recommendations for field teams.
From Photo-Based Shelf Compliance to KPI Dashboards
Goods Checker is a cloud-based SaaS platform built on computer vision for merchandising automation. A merchandiser photographs the shelf with a mobile app and the photo goes straight to the recognition engine.
The algorithm identifies each SKU, checks placement against the current planogram, spots empty slots and misplaced products, and calculates shelf share by brand and category. Processing takes up to 30 seconds, and a recognition accuracy is above 95 percent. For long shelf sections that do not fit in a single frame, the platform stitches multiple photos into one image.
Managers and category teams see the results in an analytics dashboard through a web browser: planogram compliance score, OSA rate, OOS count, shelf share, and any custom KPIs the client needs. Every data point carries a timestamp, store tag and the name of the merchandiser who captured it.
KPI-Driven AI Recommendations for Smart Merchandising
All the data from photos get into analytics dashboards that give field teams and category managers a clear view of what is happening across the store network.
A field supervisor can see which stores have the highest OOS count, which have planogram compliance scores below the agreed threshold, and which have promotional materials not yet in place as a promotion enters its first week. That replaces the manual process of reviewing visit reports and deciding where to focus based on incomplete information.
For category managers and trade marketing teams, the dashboards show patterns across the network: which store formats show the strongest correlation between facing count and off-take for a given SKU range, where shelf share is consistently below target despite acceptable compliance scores, and which promotional placements are generating the intended exposure and which are not.
Realograms as a Foundation for Continuous Merchandising Automation
The process repeats continuously. The realogram captures the current shelf state, the analytics engine compares it to the planogram and historical data, the team sees what needs attention, corrective actions are taken, and the next realogram captures the updated state.
Over time this builds a dataset of shelf states and compliance histories across the network. Patterns emerge: which conditions in which store formats produce the most consistent improvement in OSA and off-take.
Merchandising automation means field teams working from better data, making faster decisions and spending less time on paperwork.
How to Get Started with AI in Merchandising (Without Burning Your Budget)

Start with one or two use cases. Planogram compliance monitoring and OOS detection are the most practical entry points: the KPIs are well-defined and results show up quickly. Pick use cases where you already have a baseline so you can measure the difference.
Run a pilot that reflects reality, not best-case conditions. The temptation is to choose stores where everything runs smoothly. A more useful pilot includes the difficult stores, because that is where problems tend to show up first.
Define what success looks like before the pilot starts. OSA improvement by X percentage points, OOS rate down from Y to Z, audit time reduced by N minutes per store. That makes the decision to scale or not.
Evaluate time-to-value alongside total cost. A platform that can be onboarded in two to three weeks carries a meaningfully different risk profile than a custom implementation that takes six months to produce anything useful.
AI as a Lever for Merchandising Efficiency, Not a Magic Wand

Photo-based shelf compliance monitoring, IR-based OSA and OOS detection, realogram-driven planogram compliance — these work at scale and deliver measurable results. Fully autonomous stores, black-box scoring and generic AI interfaces without real shelf data are not ready for a serious budget decision in 2026.
The companies getting the most out of AI in merchandising are not chasing the most advanced technology. They picked clear KPIs, built reliable data collection and chose tools where every action connects to a measurable outcome. That is what moves the numbers.