Your company tracks sales by SKU, by store, by hour. You know which products moved yesterday and which did not. But your shelf compliance report is three days old, assembled from handwritten forms, and covers maybe a third of your outlets.
That gap is where most merchandising problems go unnoticed the longest: a product out of stock that no one flagged, a planogram approved at HQ but never verified in the field, a promo display that went up a week late and in the wrong position.
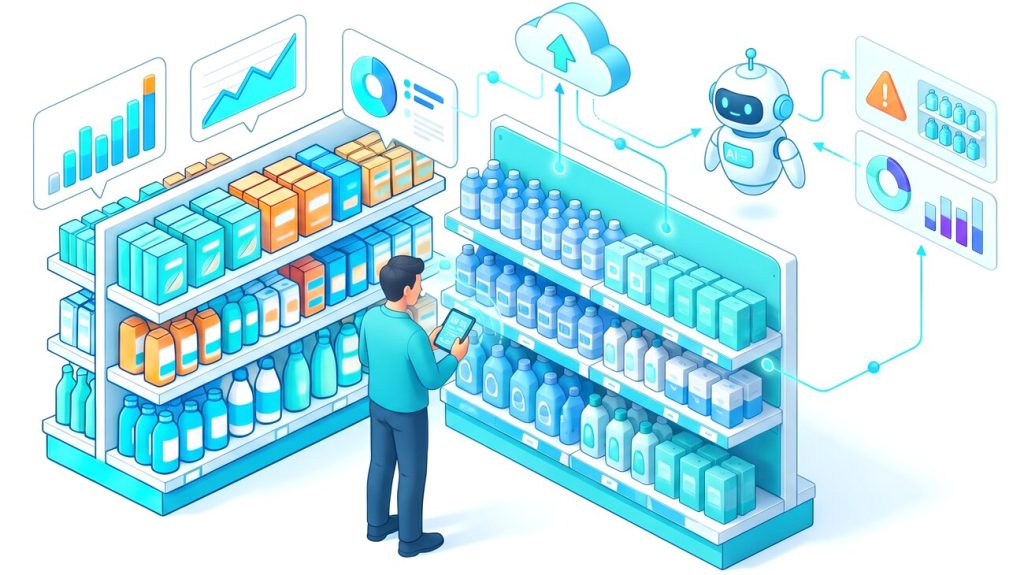
Computer vision closes that gap. Cameras or mobile apps capture shelf images; algorithms read those images and return structured data, such as which products are present, which positions are empty, where the planogram is not being followed, without anyone reviewing footage manually. The result reaches a manager’s dashboard in under a minute.
This guide explains how computer vision works in retail in plain terms. It covers the main use cases already deployed, the business outcomes each delivers, where the technology still has real limits, and what a practical pilot looks like.
Table of Contents
- What Is Computer Vision and How Does It Work in a Store?
- Key Computer Vision Use Cases in Retail
- What Business Results Does Computer Vision Deliver?
- From Planogram to "Realogram": Seeing the Shelf as It Really Is
- How Goods Checker Uses Computer Vision for FMCG Shelves
- What Computer Vision in Retail Cannot Yet Do and Why That Matters
- How to Get Started: A Simple Roadmap for Non-Tech Leaders
- FAQ: Computer Vision in Retail for Non-Tech Leaders
- Where to Go From Here
What Is Computer Vision and How Does It Work in a Store?
Computer vision is a branch of artificial intelligence that teaches software to interpret images and video the same way a person can look at a shelf and notice that a product is missing or in the wrong place, but faster and without getting tired.
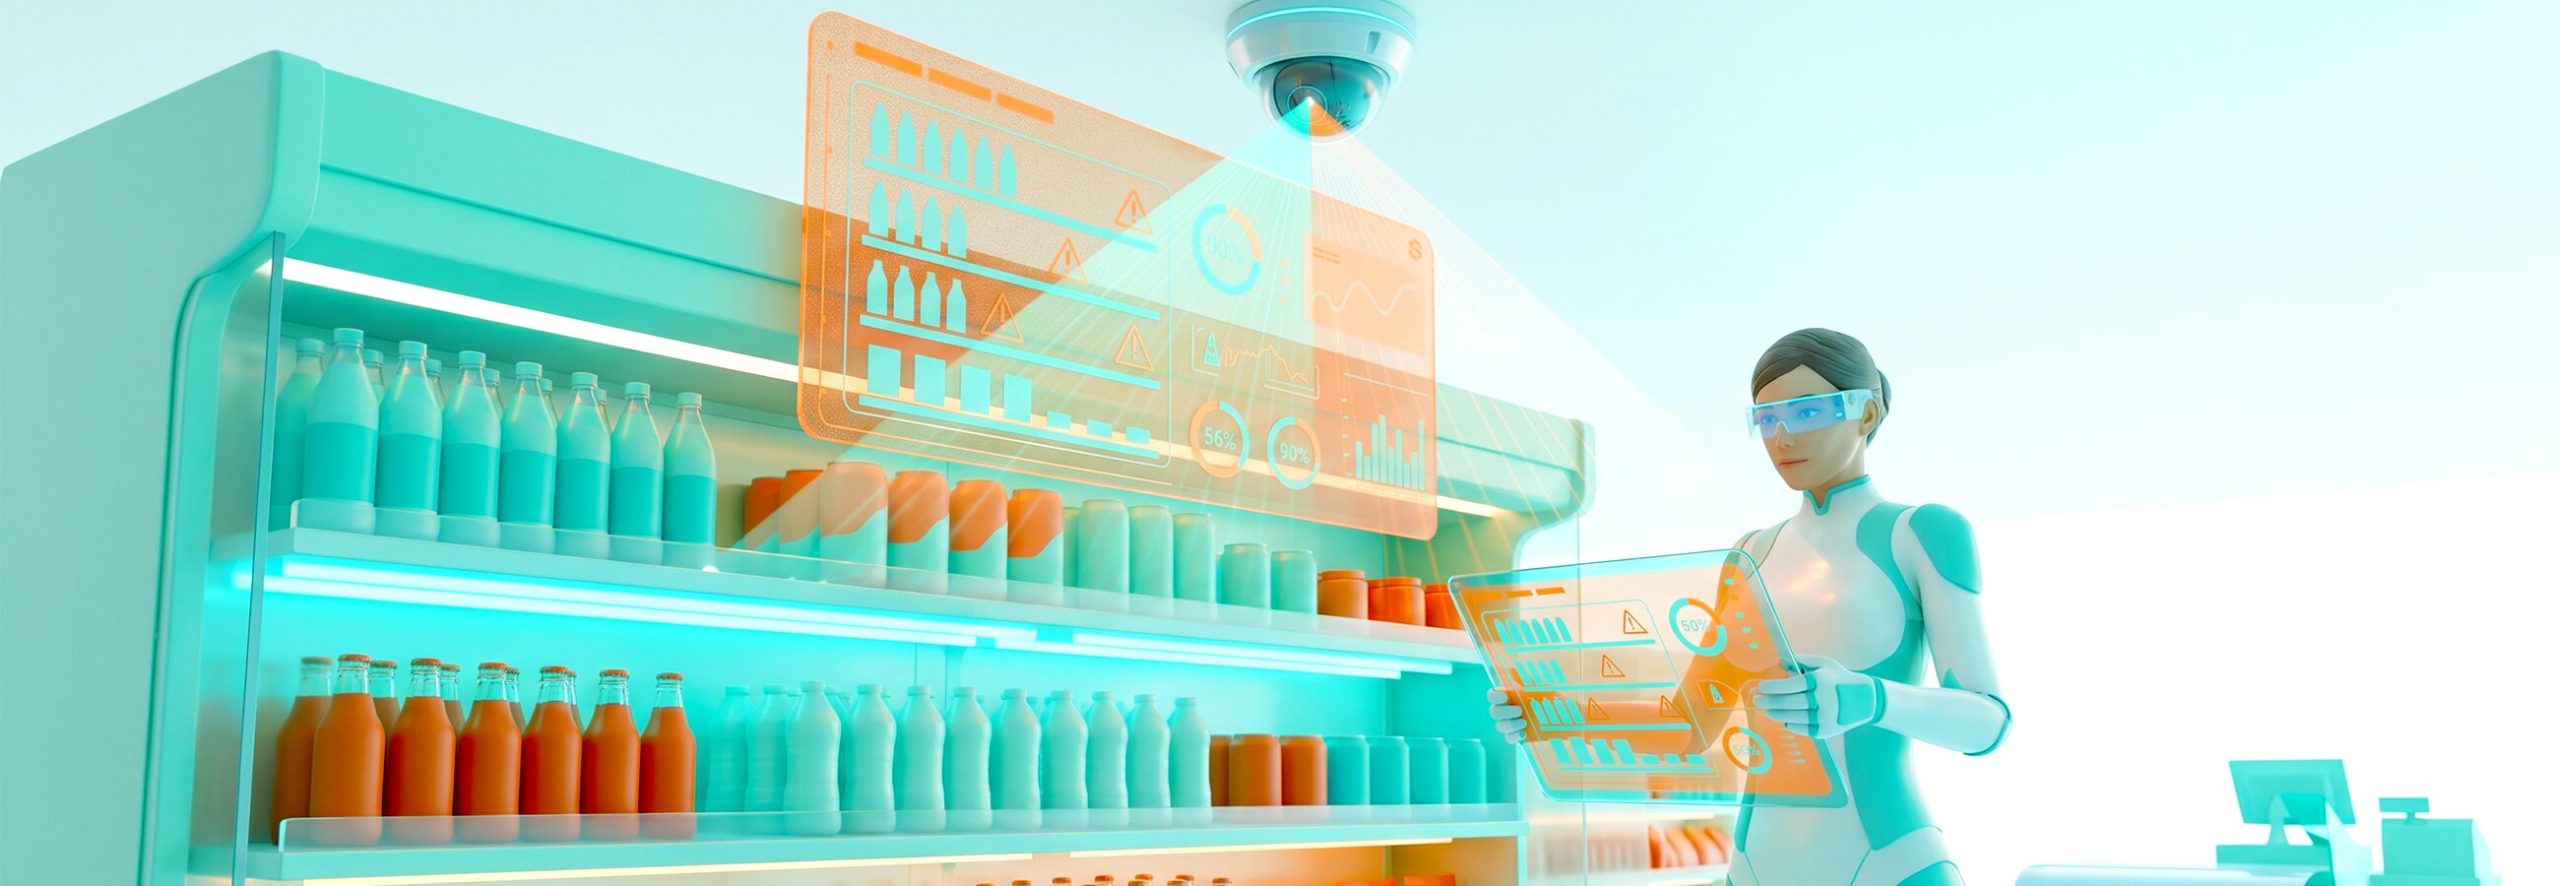
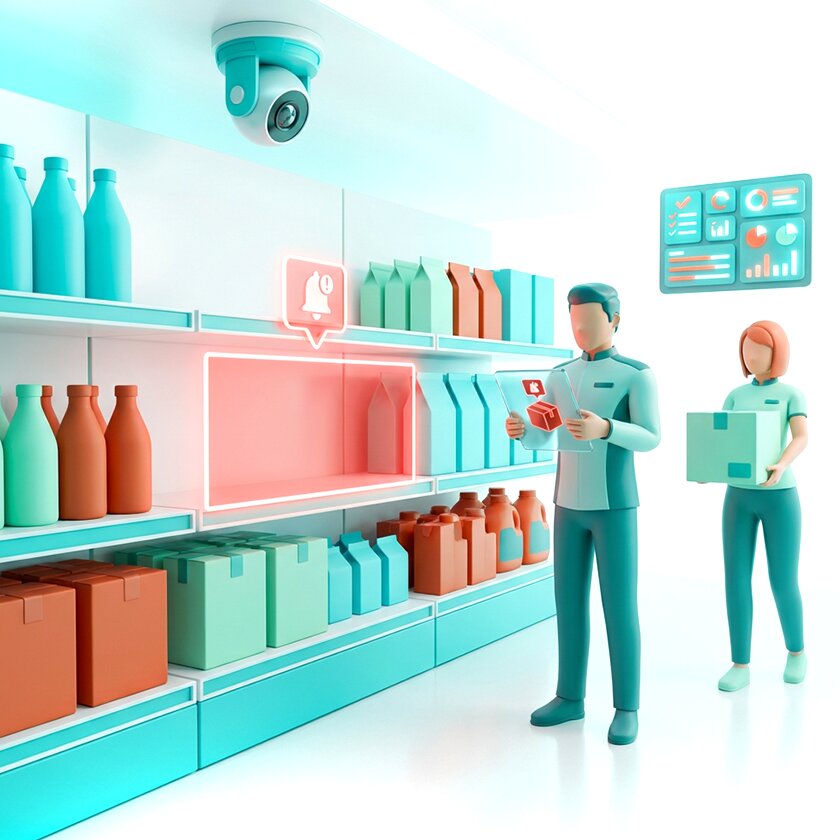
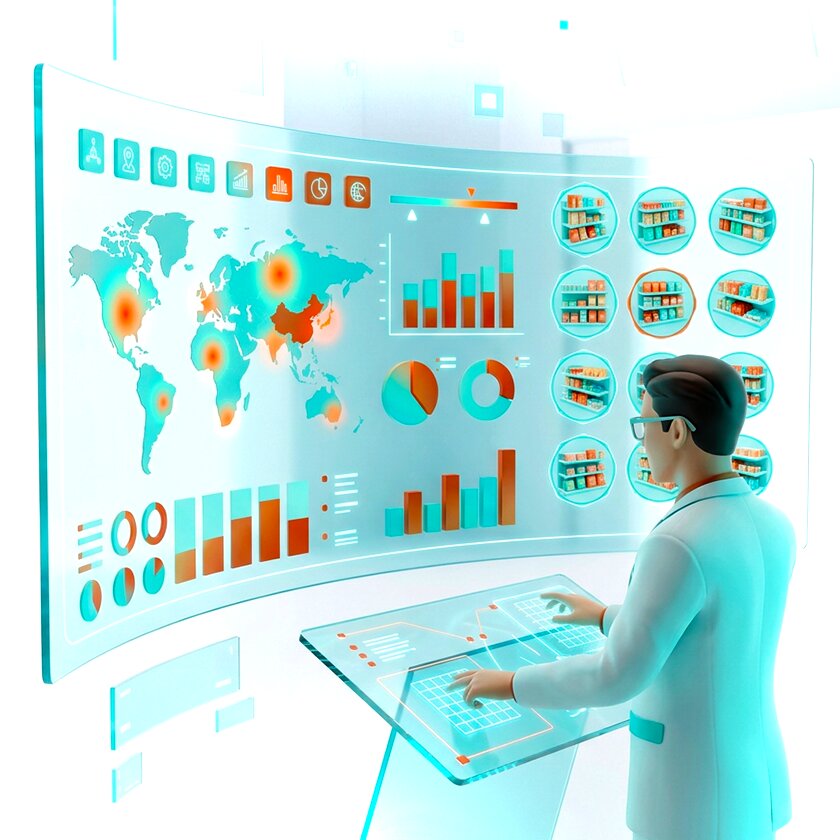
In a store setting, cameras capture images or video of shelves, checkout lanes, store aisles, or specific product areas. Algorithms analyze those images and produce structured outputs: a flag, a report, a dashboard entry. A manager does not need to watch hours of footage. The system has already identified what needs attention.
This is the key difference from ordinary CCTV. Traditional surveillance records and stores. Video analytics in retail goes further: the system notices a problem and acts on it, whether that means alerting a supervisor, updating a dashboard, or triggering a restock task. The camera becomes a data source, not just a recording device.
Key Computer Vision Use Cases in Retail
Computer vision in retail is not one technology with one application. It covers half a dozen distinct use cases, each solving a different operational problem and delivering measurable results against specific KPIs.
1. Shelf Monitoring by Photo and Product Recognition on Shelves
This is the most widely deployed application in FMCG and grocery retail, and the one with the clearest ROI documentation.
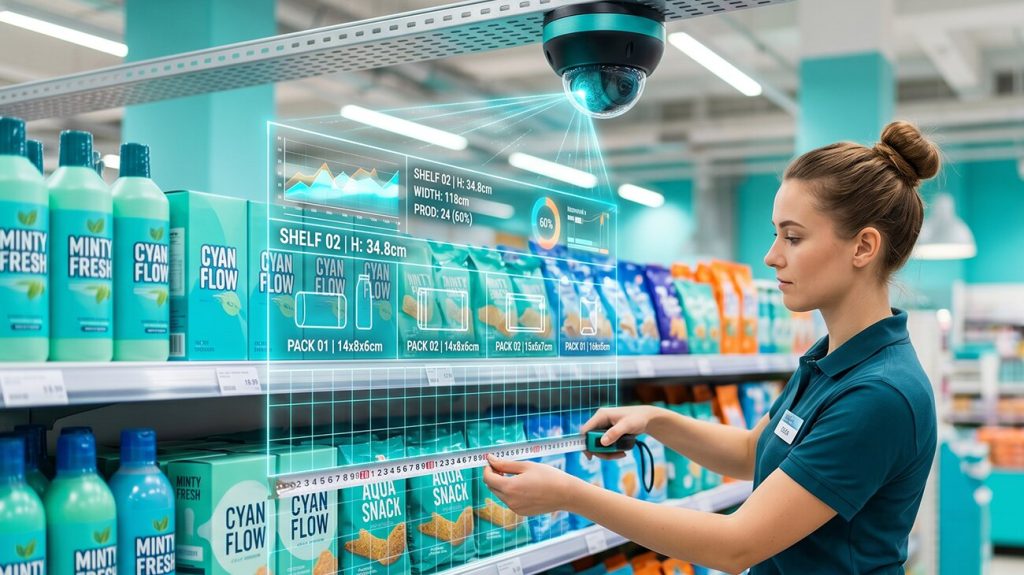
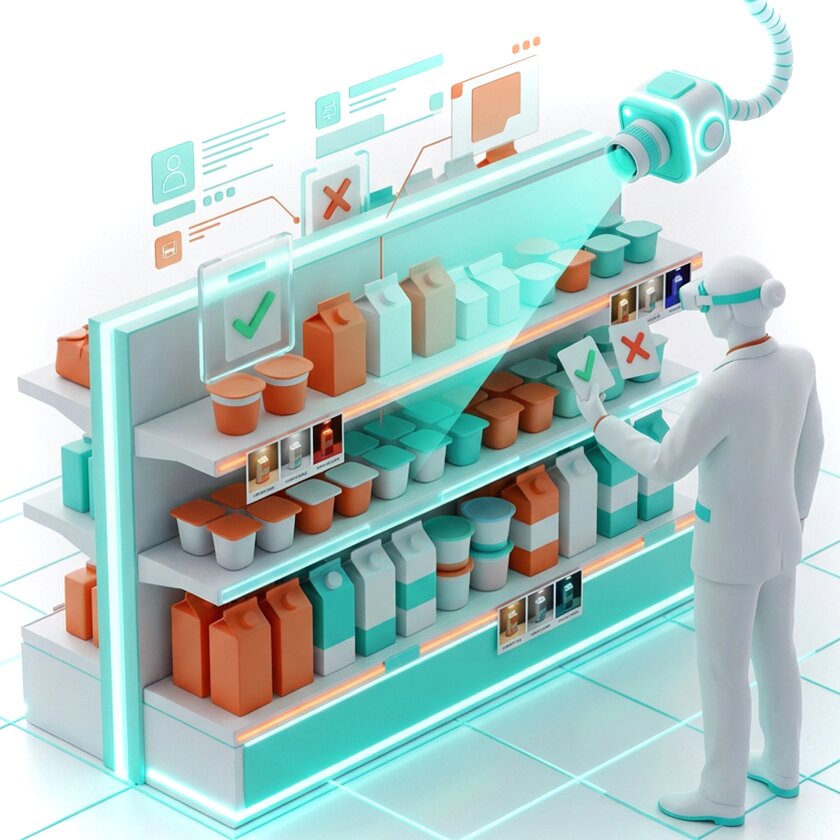
A merchandiser photographs the shelf using a mobile app or a fixed camera does this automatically throughout the day. The image is sent to a server, where algorithms perform product recognition on shelves: identifying each SKU by position, facing count, and placement within the fixture.
The system compares this against the planogram, the approved layout that defines where each product should be, how many facings it should have, and in what sequence. Any discrepancy is flagged automatically, whether that is an out-of-stock position, a product in the wrong section, or a facing count below the agreed minimum.
This produces three KPIs that merchandising teams actually care about:
- On-shelf availability (OSA): Is the product present and visible to the shopper?
- Out-of-stock (OOS): Which positions are empty, and how long have they been empty?
- Shelf share: What proportion of the fixture does each brand or category occupy?

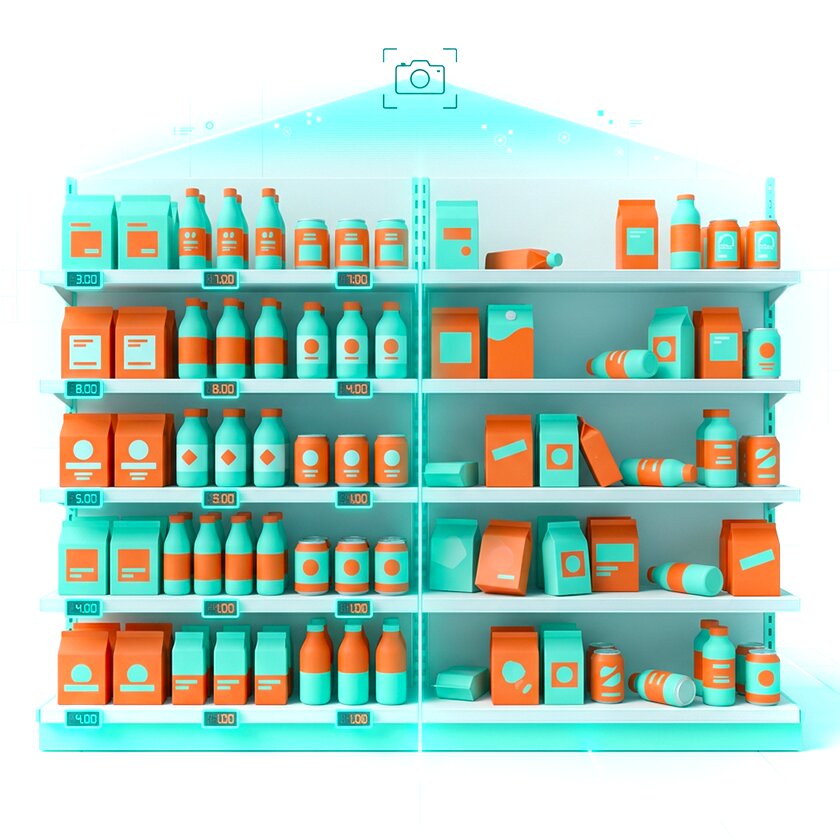
2. Price Tag Monitoring and Anti-Fraud at Self-Checkouts
Price tag errors are more common than most retailers admit: a promotion ends but the tag stays up, a product is repriced in the system but the shelf label is not updated, and the shopper pays one price while the system records another.
Computer vision reads shelf labels and compares them against the product master data in real time. Discrepancies are flagged automatically, without anyone walking every aisle checking each tag manually.
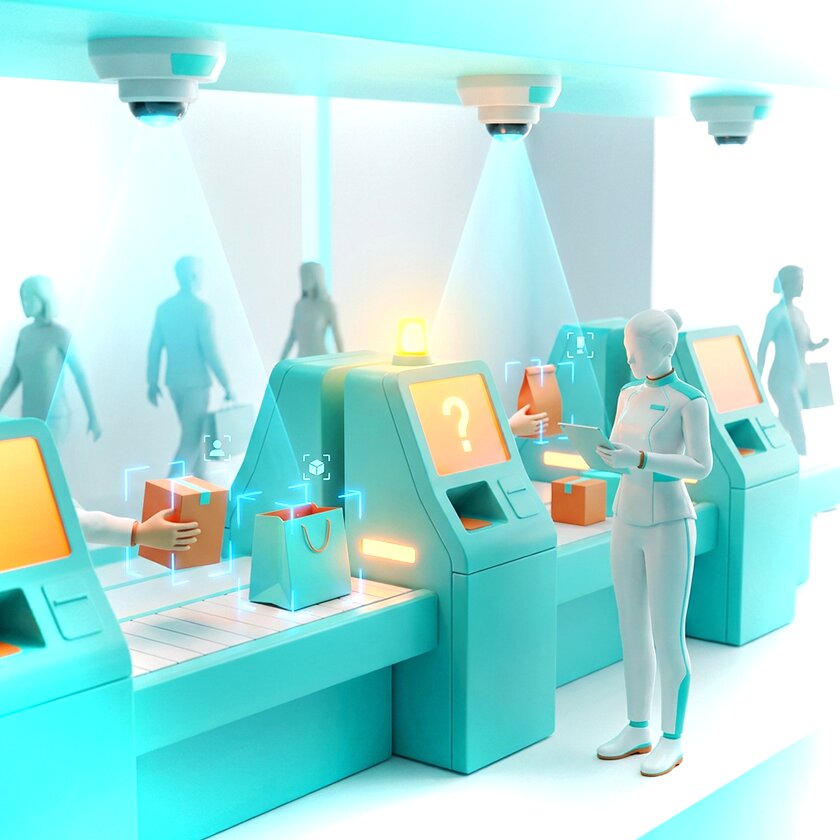
Anti-fraud at self-checkouts is a related application that addresses a different kind of mismatch. At self-service lanes, a camera positioned above the bagging area observes which product is actually placed in the bag and compares it with what was scanned. If a customer picks up an expensive item and scans a cheaper one, or skips scanning entirely, the system flags it for staff review.
The system does not accuse anyone. It sends a notification to a staff member who then makes the call, which is exactly how loss prevention works in practice.
3. Queue Management and Self-Checkout Monitoring
Queues are a direct driver of customer satisfaction scores and a reason people abandon baskets. Retail operations teams know this, but real-time queue data has historically been hard to capture.
Computer vision counts people in checkout lanes automatically and estimates wait times based on queue length and throughput. When a queue exceeds a threshold, for example, more than four people in a lane, the system alerts a floor manager to open another till. Some retailers use this data to model staffing schedules for peak periods.
Self-checkout monitoring is related but distinct. Here the goal is not just efficiency but accuracy: the system observes the self-checkout process, checks that items are being scanned correctly, and flags situations that need staff attention. The approach avoids both under-staffing (no one watching) and over-staffing (a dedicated person at every machine).
4. Loss Prevention and Store Security
Retail shrinkage, meaning loss from theft, fraud, and administrative error, represents a significant portion of gross margin for most chains. Computer vision supports loss prevention by identifying behavioral patterns associated with theft: products removed from shelves and not brought to a checkout, items concealed in bags or clothing, repeated presence in high-value aisles without purchases.
The system does not make a final call. It flags an event for a security team member to review, because what looks like suspicious behavior in a single frame often has an innocent explanation in context. The value of computer vision here is prioritization: it surfaces the cases that warrant human attention rather than asking staff to monitor dozens of camera feeds simultaneously.
5. Store Heat Maps and Customer Behavior Analysis
A store heat map is a visualization of where customers spend time in a store. Computer vision generates this by tracking anonymized movement patterns across the floor plan, not individuals but aggregate flows, so areas with high dwell time and areas that shoppers pass through quickly become visible in a single view.
Customer behavior analysis built on this data answers questions that manual observation cannot: which fixture gets the most attention, where shoppers stop and look but do not buy, which promotional display actually changes foot traffic patterns.
Retailers and brand owners use this to test planogram changes, evaluate the effectiveness of promotional placements, and identify zones that are underperforming despite a solid product range.
6. Real-Time Inventory Visibility and Planogram Compliance
Planogram compliance is one of the harder things to measure. A brand may have approved layouts for 5,000 stores, and confirming that all 5,000 are executing correctly requires either a large field team or a way to verify remotely.
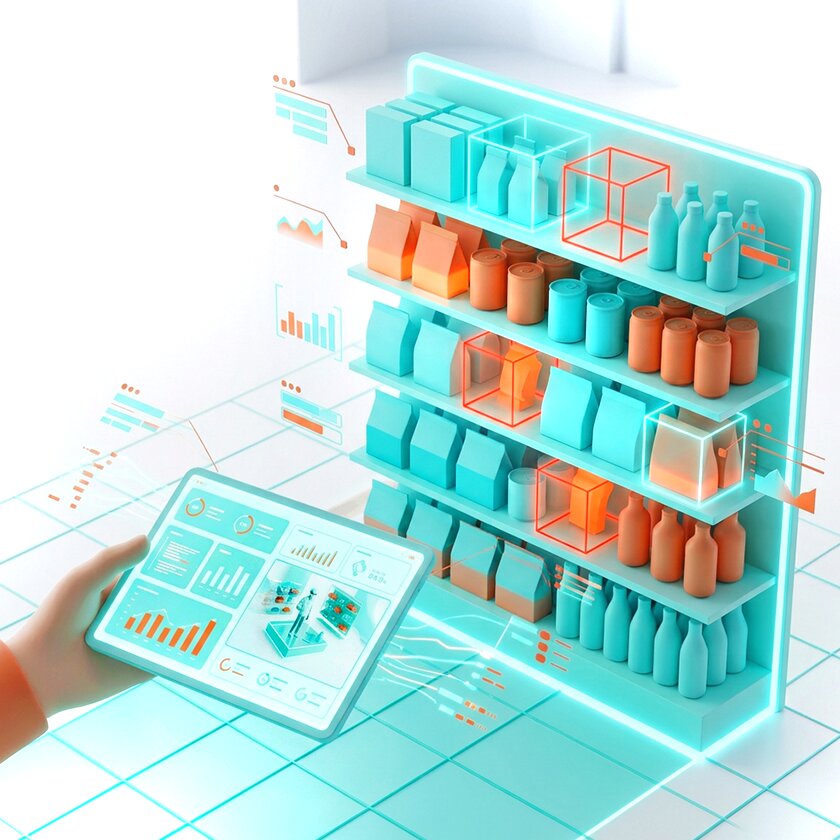
Computer vision makes remote verification viable. Merchandisers photograph shelves during visits, the app processes images on the server and returns compliance scores by store, category, and brand. Managers see which stores are underperforming and can prioritize accordingly, without waiting for weekly reports or aggregate audit averages that hide individual store problems.
For continuous monitoring, some retailers use fixed shelf cameras that capture images several times a day. This produces something closer to real-time inventory visibility: the system knows when a product drops to one facing or disappears from the shelf entirely and triggers a restocking alert before the shelf is fully empty.
What Business Results Does Computer Vision Deliver?
The operational impact of computer vision shows up in three places: how much time field teams spend on reporting, how reliable the data is that reaches managers, and how quickly problems on the shelf get addressed.
Less Manual Work, More Consistent Data
Manual shelf audits are slow. A merchandiser spending an hour per store on reporting, photographing shelves, filling out forms, and sending data to a supervisor who then manually checks it, is doing work that automation handles in minutes.
“In one deployment documented by Goods Checker, a Ukrainian merchandising agency reduced reporting time per store by 70%. Merchandisers now spend around 20 minutes on store reporting instead of an hour, and that freed time went into visiting additional stores, not administrative tasks.”
Consistency is equally important. Human audits vary by person, time of day, and workload. CV systems apply the same logic to every image, every time, which means the data is actually comparable across stores, weeks, and audit cycles.
Reduced Out-of-Stock Situations and Fewer Losses
OOS detection is faster with CV than with manual auditing because the system checks every visit, not just when a merchandiser happens to spot a gap. In categories with high velocity this matters: a shelf can go from full to empty between visits, and the first anyone knows about it is when sales data comes in two days later.
Earlier detection translates directly into fewer lost sales. The same logic applies to loss prevention, where earlier flagging of suspicious events reduces the time during which shrinkage goes unaddressed.
More Accurate Shelf KPIs
OSA, OOS, shelf share, and planogram compliance are the metrics that FMCG manufacturers, agencies, and retailers use to evaluate merchandising performance. The problem is that these numbers are only as good as the data collection behind them.
Manual audits produce a snapshot taken at a particular time by a particular person. CV-based measurement covers more visits, applies consistent logic, and produces data that can be aggregated across stores without inconsistency between auditors.The KPIs become reliable enough to support AI-powered shelf analytics, category decisions, merchandising optimization, and supplier-retailer negotiations.
Better Customer Experience
Fewer empty shelves, fewer pricing disputes at checkout, shorter queues: these are the customer-facing outcomes of operational improvements driven by CV. The technology does not change the shopping experience directly. It changes the store’s ability to deliver the experience it intends to deliver.
Why This Matters for Merchandising Efficiency
For FMCG manufacturers and merchandising agencies, the ultimate goal is not technology adoption but merchandising efficiency. Computer vision reduces reporting time, increases audit coverage, improves planogram execution, and helps field teams focus on corrective actions rather than manual data collection.
From Planogram to "Realogram": Seeing the Shelf as It Really Is
A planogram is a diagram of how a shelf fixture should look: which products go where, how many facings, in what order. Every FMCG brand has planograms, and most retailers have planogram compliance targets. A realogram is what the shelf actually looks like.
The gap between the two is the core problem that computer vision solves for merchandising teams. Without photo-based shelf monitoring, that gap is measured through infrequent manual audits, weekly at best, monthly in many cases. With CV, every visit produces a realogram, and the system compares it automatically against the planogram.
This matters because the realogram changes constantly. Products sell through at different rates, stockroom staff refill shelves inconsistently, and shoppers move products around. By the time the next manual audit arrives, the shelf may have been out of compliance for days without anyone knowing. Continuous comparison between plan and reality is what AI-powered shelf analytics delivers in practice.
Most retailers do not need to build their own computer vision platform from scratch. In practice, companies usually adopt specialized SaaS solutions focused on a specific operational area. Goods Checker is an example of this approach, focusing on FMCG shelf execution and merchandising analytics.
How Goods Checker Uses Computer Vision for FMCG Shelves
Goods Checker is a SaaS platform built specifically for FMCG manufacturers, distributors, and merchandising agencies. The platform covers the full workflow: from the moment a merchandiser photographs a shelf to the moment a regional manager sees compliance scores by store, brand, and category.
Photo-Based Shelf Monitoring and KPI Dashboards
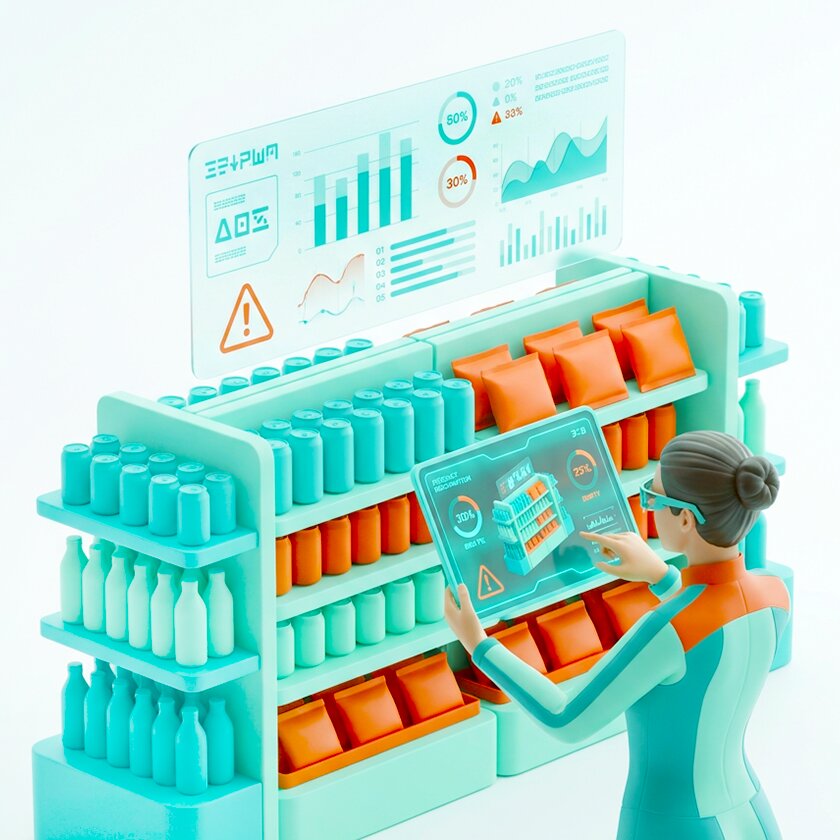
A merchandiser photographs the shelf through the Goods Checker mobile app. The image is processed in under 30 seconds. Algorithms identify each SKU, count facings, check positions against the planogram, and flag any issues. The results appear in a manager’s dashboard broken down by store, brand, region, and merchandiser.
The dashboard shows OSA, OOS, shelf share, and planogram compliance, along with the supporting photos. Managers can drill into any metric, filter by geography or category, and export data for reporting. KPIs are configurable depending on whether the client is a manufacturer, an agency, or a retailer.
Smart Merchandising Recommendations
Collecting shelf data is one thing but acting on it is another. Goods Checker uses the accumulated data to generate recommendations based on actual KPI trends: which SKUs are consistently underrepresented, which stores have persistent planogram violations, which categories have high OOS rates on certain days of the week.
These recommendations give field teams specific priorities rather than a general instruction to improve shelf presence. A merchandiser visiting a store on Monday morning can see which issues were flagged in the previous visit and address them in order.
Real Cases: What the Numbers Look Like
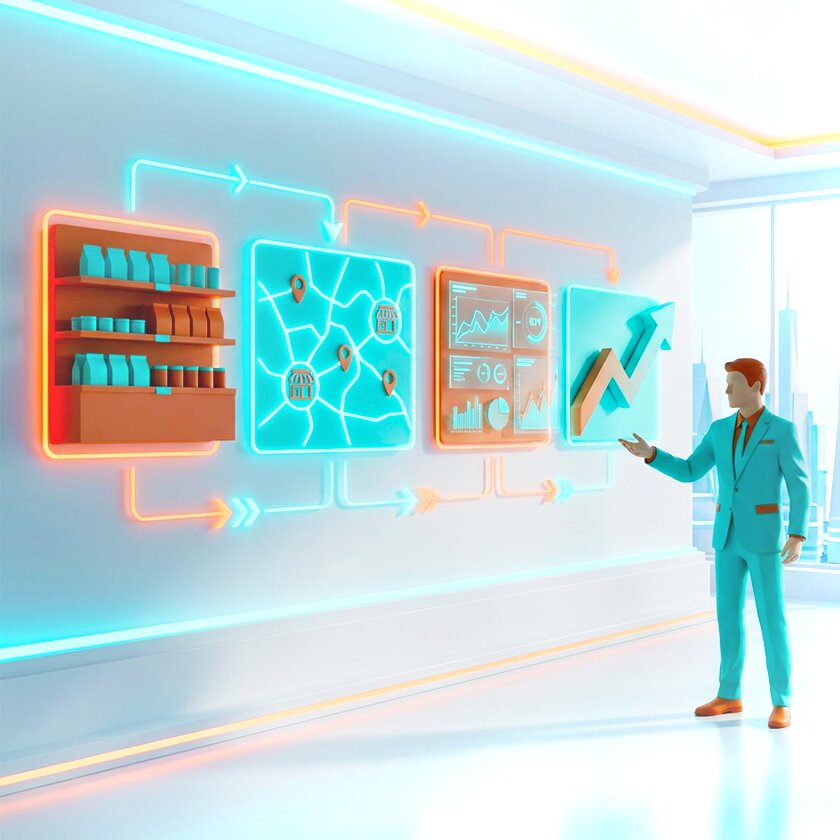
Across Goods Checker deployments, a consistent pattern appears: the first measurable impact is on reporting time, followed by an increase in audit coverage, followed by improvement in planogram compliance metrics.
One merchandising agency running operations across Ukraine deployed Goods Checker across 4,500+ outlets. The pilot covered six cities, 45 retail chains, and 694 stores in two weeks. Recognition accuracy reached 95% by the end of the pilot, with some SKUs recognized at 100% accuracy. Reporting time per store dropped by 70%, and audit speed improved by 10–50% depending on store size.
A second case involved a pharmaceutical manufacturer operating across Kazakhstan, Uzbekistan, and Kyrgyzstan, covering 8,800 pharmacy outlets. Representatives visited pharmacies briefly, and manual shelf checks were inconsistent. After deploying Goods Checker, recognition accuracy exceeded 90% and the average time per pharmacy visit dropped to under five minutes.
These numbers reflect what happens when field data collection is automated and made consistent: the bottleneck shifts from data gathering to decision-making. More detail on how merchandising KPIs are measured and managed is in our merchandising KPIs guide.
What Computer Vision in Retail Cannot Yet Do and Why That Matters
It is worth being direct about limitations, because the hype around AI in retail often oversells what is actually deployable today.
- Image quality is a real constraint. CV systems depend on clear, well-lit images, and in stores with poor lighting, crowded shelves, or obstructions, recognition accuracy drops. Goods Checker and similar systems use image augmentation techniques and synthetic training data to handle variability, but this is not a zero problem.
- Complex scenarios require human judgment. CV can flag a suspicious event at a self-checkout but cannot determine intent. It can identify that a shelf does not match the planogram but cannot tell you why, whether the problem is a stockout, a restocking error, or a deliberate range change.
- Privacy and compliance requirements apply wherever cameras track customer movement or behavior. In many markets this means anonymization requirements, signage obligations, and data retention limits. These are manageable but need to be addressed in the deployment design, not after the fact.
- Integration takes time. Connecting a CV platform to existing IT systems such as ERP, WMS, or BI tools is not a plug-and-play process. API integration requires development work, and the quality of that integration determines whether the data actually reaches decision-makers in a usable form.
- None of these mean the technology is not worth deploying. They mean the deployment needs to be designed with clear scope, realistic expectations, and a defined pilot process.
How to Get Started: A Simple Roadmap for Non-Tech Leaders
You do not need to understand machine learning to run a successful computer vision pilot. You need clear answers to four questions before you start.
- What problem are you solving first? Pick one or two specific use cases, not “AI in retail” in general. Shelf monitoring by photo is the most common starting point because the business case is clear and results are measurable quickly. Price tag compliance is a good second use case. Queue management is worth considering if customer experience scores are a current priority.
- Where will you pilot? Choose 5–20 outlets that represent different store types, geographies, or retail chains. Avoid picking only your best-performing stores — you want the pilot to surface real problems.
- What will you measure? Define the KPIs before the pilot starts. For shelf monitoring: OSA, OOS rate, planogram compliance score, and reporting time per visit. Agree on what “success” looks like numerically, for example, a 20% reduction in OOS, a 15% improvement in compliance score. Thus, the post-pilot decision is based on data, not impressions.
- How will you scale? A pilot is only worth running if you have a plan for what comes next. If results meet the threshold you defined, how long will rollout take? What IT integrations are required? Who owns the process change on the field team side?
FAQ: Computer Vision in Retail for Non-Tech Leaders
What is computer vision in retail in simple terms?
It is software that reads images and video from cameras in a store and turns them into structured business data: which products are on which shelves, which positions are empty, how long queues are, where customers spend most time. The output is numbers and alerts, not raw footage.
Do we need new cameras, or can we use existing CCTV?
For shelf monitoring by photo, existing smartphone cameras are sufficient: merchandisers photograph shelves using a mobile app. For continuous shelf monitoring or queue management, fixed cameras may be needed. Compatibility with existing CCTV infrastructure depends on the platform and the resolution of the installed cameras. It is worth checking with the vendor before assuming either that existing cameras will work or that new ones are required.
How is computer vision different from standard video surveillance?
Standard CCTV records and stores footage for later review. Computer vision systems process images automatically and produce structured outputs: flags, reports, dashboard data, without anyone reviewing the raw footage. The difference is between a recording device and an analytical tool.
Is computer vision in retail compliant with customer privacy regulations?
Applications focused on product recognition and shelf monitoring do not involve tracking individual customers, so they raise fewer privacy concerns. Applications involving customer behavior analysis or queue monitoring need to comply with local regulations, typically through anonymization and appropriate disclosure. A responsible vendor will address this in the implementation design.
How long does it take to launch a pilot and see results?
For a SaaS-based shelf monitoring solution, a pilot covering 20–50 stores can be running within two to three weeks. The data from the first visits is available immediately. Meaningful trend data, enough to evaluate whether OOS rates are improving or planogram compliance is increasing, typically requires four to eight weeks of consistent use.
Where to Go From Here
Computer vision in retail is not a future technology. It is deployed, documented, and generating measurable results for FMCG manufacturers, merchandising agencies, and retail chains operating today.
The gap between companies using it and companies that are not is mostly a gap in starting. The pilot timeline is short, the required investment is lower than most IT projects, and the KPIs are straightforward to measure.
If you are evaluating whether shelf monitoring or a related application makes sense for your operations, the practical next step is a conversation about scope, not a technology evaluation. What problem are you solving, in which stores, by which metric? That is where the decision actually lives.