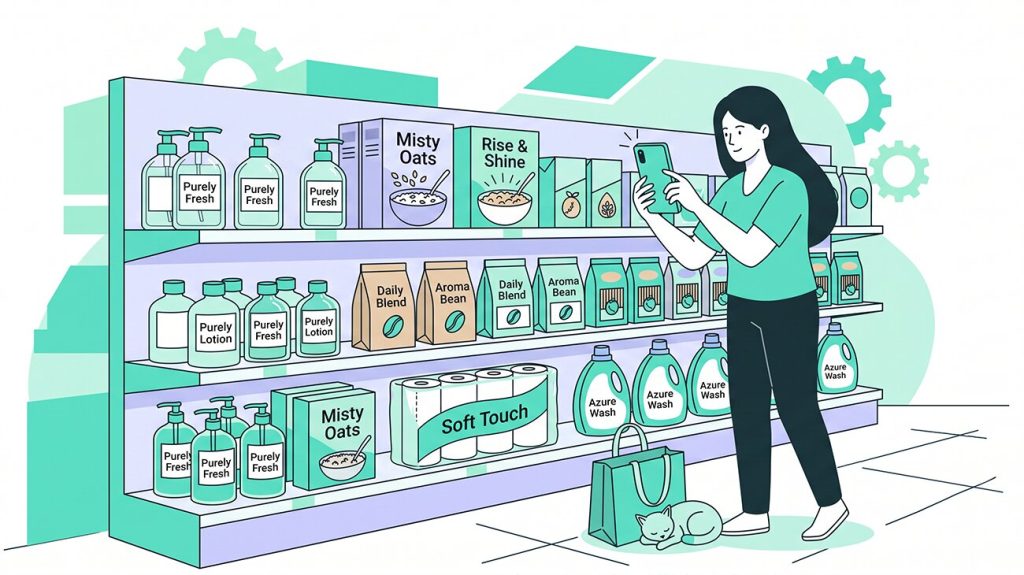


According to every document on your desk, the shelf situation is under control: the planogram locks in 8 facings, the paid share agreement covers 22% of the category, and last week’s field report came back without a single red flag.
Then your rep visits the store on a Tuesday and finds 5 facings, a competitor filling the gap where your new product should sit, and a promotion that ended three weeks ago still showing the old price label. Nobody flagged it because nobody had data that said something was wrong.
This is the gap that share of shelf analysis exists to close. This guide covers what share of shelf is, how to calculate it using three main methods, where manual measurement reliably fails, and why FMCG and CPG teams in 2026 are moving to computer vision and SaaS tools to get data they can genuinely act on.
Table of Contents
- What Is Share of Shelf in Retail?
- How Do You Calculate Share of Shelf? Three Main Methods
- Paid Share, Fair Share and Actual Share: Three Numbers Every Category Manager Needs
- How Share of Shelf Links to Sales, Off-Take and Marketing KPIs
- Manual Share of Shelf Calculation: How It's Done and Where It Goes Wrong
- Why Manual Share of Shelf Measurement Is Too Slow and Expensive in 2026
- How Computer Vision and SaaS Tools Automate Share of Shelf Analysis
- How Goods Checker Measures Share of Shelf for FMCG Brands
- How Often Should You Measure Share of Shelf — and for Which SKUs?
- How to Use Share of Shelf Data to Identify Growth Opportunities
- Share of Shelf Is Dynamic — Your Measurement Has to Be Too
- Share of Shelf FAQ
What Is Share of Shelf in Retail?
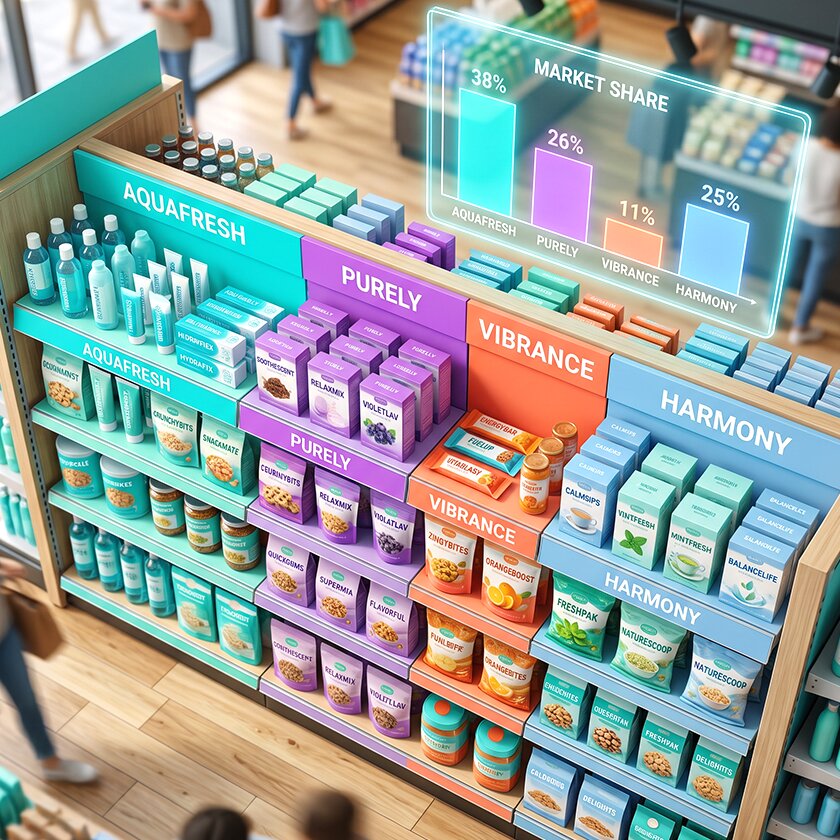
Share of shelf (SoS), also called forward share on shelf, measures the percentage of physical shelf space a brand occupies within a specific product category. If a shampoo section runs 200 cm wide and your brand covers 40 cm, your SoS is 20%.
Two points matter here:
- SoS is a category-level metric: you measure it within the haircare section, not across the whole store.
- SoS is a space metric, not a sales metric. It tells you how much shelf real estate you hold, not whether that space is producing returns. The gap between the two is where the key decisions sit, because a brand can be over-spaced relative to its sales or under-spaced relative to its velocity, and each situation calls for a different response.
How Do You Calculate Share of Shelf? Three Main Methods
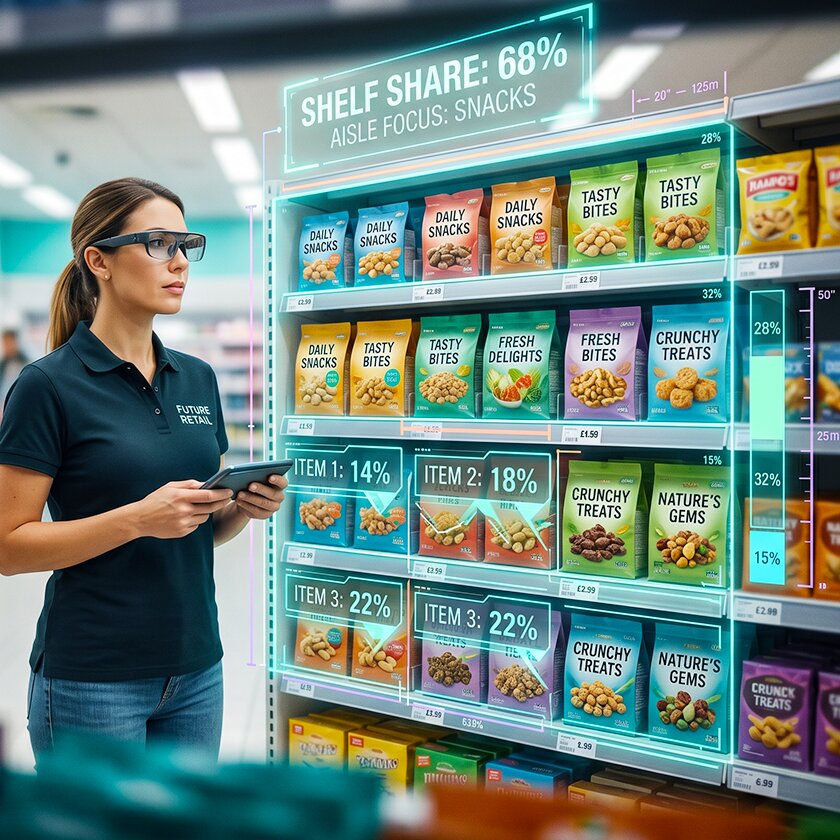
There is no single correct share of shelf formula. The right calculation depends on the category, the type of products, and what question you are trying to answer. Three methods are in common use, each with its own logic and limitations.
Method 1: Facings Count
The facings method counts how many individual product units are visible at the front of the shelf.
SoS (%) = (Brand facings ÷ Total category facings) × 100
Example: 12 brand facings out of 60 total = 20% SoS.
This approach works well when products in a category share roughly the same pack size, as in ambient grocery, snacks, or confectionery. The distortion appears when packaging widths differ: a 1-litre detergent bottle takes up two to three times the physical space of a standard format but still counts as one facing.
A brand with wide-format packs can show 15% facing share while physically occupying 25% of the linear space, which works either for or against you in negotiation depending on which side of the table you sit.
Method 2: Linear Shelf Space
Linear share of shelf measures the physical width a brand occupies, in centimetres.
SoS (%) = (Brand linear cm ÷ Total category linear cm) × 100
Example: 48 cm of brand space across 240 cm of category = 20% SoS.
This is more accurate for personal care, household cleaning, and categories where pack formats vary widely. A 500ml body wash and a 1000ml bottle are not equivalent in space, and linear measurement captures that difference. The limitation is that it ignores shelf height and depth, so a product at eye level counts identically to one on the bottom shelf.
Method 3: Eye-Level Weighting and Share of Eye
Eye-level positions, often called the diamond zone or buy zone, convert at higher rates than top or bottom shelves. Weighted SoS accounts for this by applying coefficients to different shelf levels: eye-level facings might carry a weight of 1.5 or 2.0, while bottom-shelf facings are weighted at 0.5.
If a competitor holds fewer total facings but twice the eye-level exposure, their commercial SoS may be higher than a standard facings count suggests, and that difference shows up in conversion data.
Which Share of Shelf Formula to Use When
Use facings for uniform pack formats in ambient grocery and snacks; use linear share of shelf for personal care, household, and beverages where packaging varies widely; use eye-level weighting when making the commercial case to a retailer in a range review or new product negotiation. In practice, leading teams use linear measurement as the baseline and add position weighting when they need to show the commercial value of space, not just the quantity.
Paid Share, Fair Share and Actual Share: Three Numbers Every Category Manager Needs
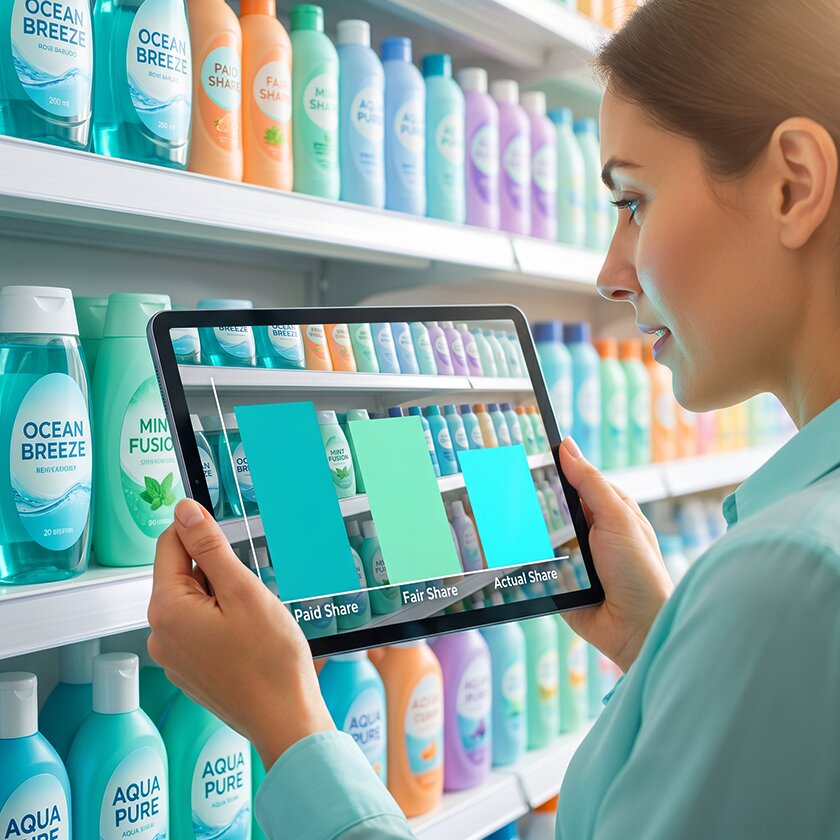
Most SoS discussions treat it as a single number. In practice there are three distinct versions, and the gaps between them reveal most of what you need to know about shelf execution and where revenue is quietly leaking.
Paid Share: The Space You Paid For
Paid share is what your listing agreement, joint business plan, or shelf-space contract says you should hold. It is the SoS built into the approved planogram, and it is the baseline against which everything else is measured. If you negotiated 22% of the cereal category in a given chain, that figure is your paid share.
Fair Share: The Space Your Sales Justify
Fair share of shelf is the SoS your brand would hold if space were allocated strictly in proportion to sales velocity or market share. If your brand drives 18% of category sales, fair share says you should hold approximately 18% of category space.
The gap between paid share and fair share is a live negotiation variable. If your SoS sits below your market share, you are under-spaced and have a documented argument for more facings. Share of shelf marketing, in practice, means using fair share analysis to show a retailer that giving your brand more space will generate more category revenue rather than simply shifting volume from a neighbouring product on the fixture.
Actual Share: What the Shelf Shows Today
Actual share is what a photo of the shelf right now would reveal. After resets, stockouts, staff substitutions, and the normal entropy of retail execution, actual share regularly diverges from both paid and fair share. A brand with 22% paid share but 14% actual share is losing sales on every shopping trip in every store where that gap exists. The loss does not surface cleanly in sell-out data; it registers as a general underperformance that nobody can trace back to shelf execution without measuring it directly.
How Share of Shelf Links to Sales, Off-Take and Marketing KPIs
SoS is not a standalone metric. Used well, it is an input to commercial decisions.
Share of Shelf vs Market Share and Off-Take
Increasing SoS from 10% to 15% in a category with high impulse purchase rates typically produces a real off-take gain, since more visible products get chosen more often. Beyond a certain threshold, additional space produces diminishing returns: holding 40% of a category section while driving 20% of category sales means the extra facings are not converting proportionally.
The practical implication is that share of shelf analysis should compare shelf share to off-take at the SKU level, not at the brand aggregate. When individual SKUs are examined, some are under-spaced relative to their velocity and others are over-spaced, and bundling them together into a single brand SoS number hides both problems at once.
Share of Shelf in Trade Marketing and Promotion Effectiveness
Promotional periods create two SoS problems that teams routinely underestimate. If a brand runs a price promotion without a secondary display, the volume uplift depends entirely on in-fixture availability.
For example, when baseline SoS is 15% and the promotion drives 40% demand uplift, the shelf goes empty before replenishment catches up, meaning the trade investment generated demand that the shelf could not fulfil.
“Competitors rarely stay passive during a rival’s promotion. They often use the same window to push for additional facings, and if they succeed, your SoS gain shrinks at exactly the moment visibility matters most. Measuring SoS at the start and midpoint of a promotional period is the only way to confirm whether the space held through the peak selling days.”

Manual Share of Shelf Calculation: How It's Done and Where It Goes Wrong

Manual share of shelf calculation is how most teams still operate. Understanding exactly where it fails explains why the gap between recorded data and actual shelf conditions can be so large.
Eyeballing, Facings Count and Tape Measures in the Aisle
In practice, a rep or merchandiser walks to the category section, counts brand facings, estimates total section facings, and writes down a number. If thorough, they do a quick scan of competitors. Almost nobody pulls out a tape measure, and in most cases the process takes four to six minutes while the rep covers fifteen to twenty stores that day.
Most teams record linear space by visual estimate rather than physical measurement. What goes into the report reflects how the rep perceived the shelf that morning, not a consistent and repeatable figure.
Typical Errors and Distortions in Manual SoS
Three problems compound in manual measurement.
- Inaccuracy: single-facing losses are routinely missed. A product showing two facings instead of three is hard to catch visually under time pressure, competitors with similar packaging get miscounted, and pack widths get estimated rather than measured, introducing consistent bias into linear share figures.
- Slowness: data typically reaches a decision-maker the following day or later. By that point the shelf may have changed again, and any correction window has already narrowed.
- Staleness: manual audit cadence is usually weekly in key accounts and monthly or quarterly elsewhere. A reset error that occurs on Monday will not appear in data until the next audit cycle, and during a promotional period that can mean four or five selling days with reduced SoS that nobody detects.
The Trax Research: Manual Audits and the Accuracy Gap
According to Trax Retail research, manual audit techniques are “inaccurate, subjective and incomplete” by nature, and by the time the data is collected and analysed, it is likely already out of date.
Large-scale computer vision deployments across retail accounts have documented discrepancies of up to 18% between manually recorded SoS figures and measurements captured by computer vision systems. For a brand holding a 22% paid share, an 18-point measurement error means believing execution is compliant while missing nearly a fifth of contracted space. Across hundreds of stores, that level of divergence produces significant undetected revenue loss that never surfaces in the audit as a flagged issue.
Why Manual Share of Shelf Measurement Is Too Slow and Expensive in 2026

The accuracy problem is widely documented, but the cost and scalability problem receives less attention. A rep spending 5 to 8 minutes per section on a top-20 SKU programme across 150 key accounts weekly generates roughly 300 rep-hours per month on SoS data collection alone, and the total grows when data entry and reporting are added. Outsourced audits cost more per visit and still deliver data with a 24-to-48-hour lag, which is operationally useless during a promotional window or in the first days after a reset.
The underlying constraint is frequency. Catching reset errors in the first week, monitoring SoS through a promotional period, verifying planogram compliance after a range review: all of this requires a measurement cadence that matches the pace of shelf changes. Manual auditing cannot reach that frequency without proportional increases in headcount and cost.
How Computer Vision and SaaS Tools Automate Share of Shelf Analysis
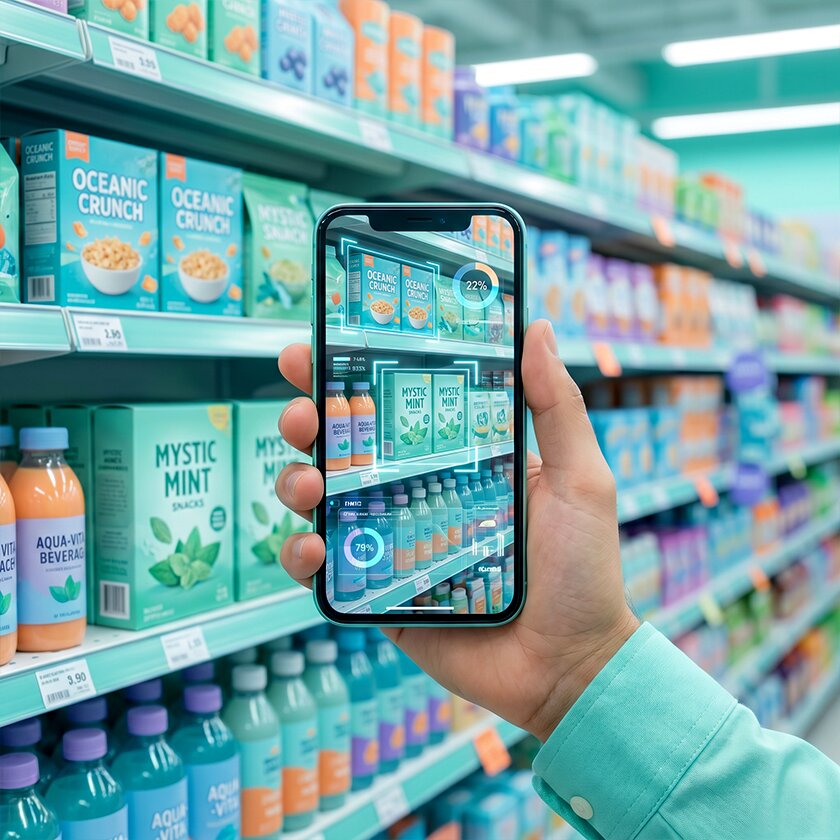
Computer vision replaces the manual count with a photo-based process that runs faster, covers more SKUs, and does not depend on the auditor’s attention under field conditions.
From Manual Counts to Photo-Based Share of Shelf Calculation
A rep photographs the shelf section with a mobile device. The CV model identifies every SKU visible in the frame, counts facings, measures linear space based on known product dimensions, and determines shelf position. It calculates SoS across three dimensions: facings count, linear share, and position-weighted share. The result reflects what is actually on the shelf, not an estimate made under time pressure.
What a Visit Looks Like with Image Recognition
The whole shelf audit takes under three minutes. The rep photographs each category section on arrival, and within 60 to 90 seconds the app returns an SoS score by brand and SKU, a gap report against the planogram, and a breakdown by shelf level. If actual SoS is 14% against a paid share of 22%, the discrepancy is visible immediately and can be addressed in the same visit. The category manager sees the same data within the hour, not the following day.
Why Computer Vision Becomes the New Standard for Share of Shelf in 2026
Four factors are driving adoption, and together they address the limitations of manual auditing at every level. Accuracy improves because CV systems identify SKUs and measure space without the fatigue or training variability that affects human auditors, producing consistent results across reps and visits. Speed changes the workflow entirely, with data moving from shelf to dashboard in under two minutes rather than 24 hours. Frequency becomes practical because photo capture is fast enough to happen on every store visit, giving top-volume SKUs in key accounts weekly SoS data at no additional labour cost.
Finally, systematic collection across many visits builds a timestamped record of actual SoS that supports credible space arguments in a range review far more convincingly than verbal claims do.
How Goods Checker Measures Share of Shelf for FMCG Brands

Goods Checker is a computer vision platform for FMCG field teams that handles share of shelf measurement as part of a broader shelf execution workflow.
Reading the Full Category Shelf, Not Just the Brand
A structural weakness in some shelf tools is recognising the brand’s own SKUs accurately while treating everything else as a residual. This creates a wrong denominator: if total category space is assumed rather than measured, the SoS percentage is unreliable from the start.
Goods Checker reads the full category section including all competitor SKUs, producing an accurate denominator and making the SoS calculation meaningful for category-level arguments with retailers.
From Planogram to Realogram: SoS with Position and Height
Beyond facings and linear space, Goods Checker captures shelf position data: which tier a product occupies, whether it falls in the eye-level band, and whether its position matches the planogram.
This produces a position-weighted SoS figure alongside the standard metrics. In a range review, the difference between “we hold 20% of the category” and “we hold 20% of the category with 35% of eye-level space” is material and substantially harder for a retailer to dismiss.
Turning SoS Data into Actions and Negotiation Power
A team at a mid-sized beverage brand with 500+ store accounts used two months of visit data to show that their actual SoS in a major grocery chain averaged 16% against a paid share of 21%.
The gap was invisible in their monthly audit reports, but with timestamped data across 80 stores they brought the documented discrepancy to the retailer as a compliance issue and secured both a planogram correction and a commitment to weekly facing checks in the top 30 accounts.
In a separate case, a personal care brand used SoS data taken at the start and midpoint of a promotional window to show that a competitor had expanded facings during their campaign, partially offsetting the promotion’s impact. The data fed directly into the post-promo review and shaped the following season’s trade investment plan.
How Often Should You Measure Share of Shelf — and for Which SKUs?
Not every product needs weekly measurement, and the right cadence depends on velocity, account importance, and event timing. Top-20 SKUs by sales velocity in key accounts should be measured on every visit, since these products drive the most revenue and are most exposed to execution gaps and competitor moves. Long-tail SKUs are best measured at resets and range reviews, when SoS changes most and the data is most actionable.
Two windows are non-negotiable regardless of SKU tier: the first two weeks after a reset, and the opening and midpoint of any promotional period. Reset errors settle in the first fortnight, and promotional SoS gaps emerge at peak demand, which is precisely when they carry the highest revenue cost.
How to Use Share of Shelf Data to Identify Growth Opportunities

SoS data becomes most useful when compared against something concrete: market share, off-take, or competitive position.
- Securing additional space with fair share analysis. A snack brand found its SoS averaged 17% across a national grocery chain while its measured market share in that channel sat at 23%. Three months of consistent visit data confirmed the pattern across store formats and regions. In the next range review, the category team presented store-level data showing the brand generated 23% of category revenue while holding 17% of space, and the retailer agreed to a planogram revision.
- Protecting facings against private label expansion. A dairy brand noticed that in stores receiving a planogram revision in the previous 60 days, SoS ran 3.5 percentage points lower than in stores without a recent reset. Investigation showed private label had systematically gained facings in the revised planograms at the brand’s expense. The SoS data turned a general commercial concern into a documented compliance case with specific stores and dates to challenge.
- Optimising NPD rollout. A beverage team launching a new format measured SoS weekly across a 60-store pilot to verify that the product was holding its agreed shelf space. Data from the first four weeks showed 22 stores where the new SKU had lost an average of two facings within the first fortnight. The team corrected the gaps before the national rollout, avoiding a launch that would have underperformed through execution failure rather than any weakness in demand.
Share of Shelf Is Dynamic — Your Measurement Has to Be Too
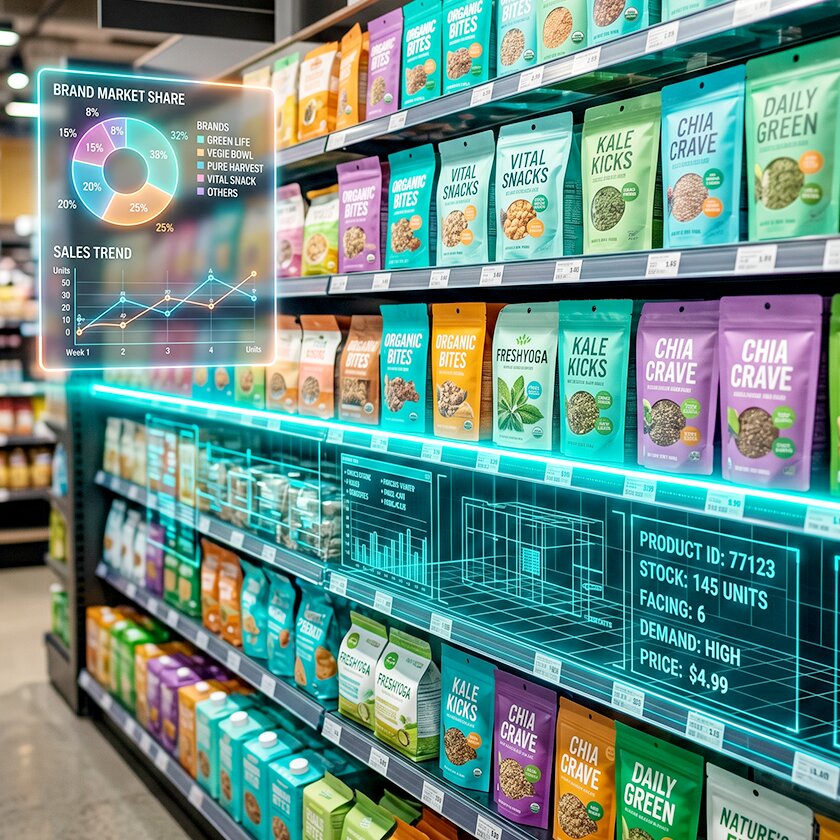
The shelf changes between visits as competitors restock, staff substitute products, and resets introduce errors that can persist for weeks if nobody catches them. Share of shelf is not a fixed number established in a planogram and assumed to hold until the next quarterly review.
Measuring it accurately and frequently enough to act on is what separates teams that manage their shelf position from teams that find out what happened after the fact. In 2026, manual share of shelf calculation is a structural limitation: the frequency, accuracy, and cost efficiency needed to make SoS data genuinely useful all point toward photo-based, CV-powered measurement as the working standard. Goods Checker and similar platforms have made this accessible for mid-sized FMCG teams, producing SoS data that arrives in time to fix the problem and is documented well enough to build a negotiation around.
Share of Shelf FAQ
What is share of shelf?
Share of shelf is the percentage of physical shelf space within a product category that a brand occupies. It is measured at the category level, not across the whole store.
What is the share of shelf formula?
Two main formulas are used.
Facings method: SoS (%) = (Brand facings ÷ Total category facings) × 100.
Linear method: SoS (%) = (Brand linear cm ÷ Total category linear cm) × 100.
What's the difference between facings share and linear share?
Facings share counts individual product units visible at the front of the shelf. Linear share of shelf measures physical shelf width in centimetres and is more accurate when pack sizes vary significantly within a category.
What is fair share of shelf?
How does share of shelf relate to market share?
Market share reflects consumer purchasing behaviour, while share of shelf reflects physical shelf allocation. When a brand’s SoS is significantly below its market share, it is under-spaced and likely leaving sales on the shelf.
Why doesn't manual auditing track share of shelf accurately?
Manual auditing has three structural problems: inaccuracy from visual estimation under time pressure, slowness in getting data to decision-makers, and staleness because audit frequency is too low to capture shelf changes between visits.
How does image recognition calculate share of shelf?
A computer vision system analyses a shelf photo, identifies every SKU, counts facings, and measures linear space based on known product dimensions. It calculates SoS across facings, linear space, and shelf position in under two minutes, producing consistent results regardless of which rep captured the image.