

Startups know the rule: you have 30 seconds to pitch an investor in an elevator. A brand on a retail shelf gets even less time. Shoppers spend 5 to 10 seconds in front of a display and either pick up a product or move on. A chaotic shelf wastes those seconds because nothing catches the eye and nothing guides the choice. A well-built planogram solves this by setting clear priorities, highlighting the key product, and directing the shopper’s attention exactly where it needs to go.
A planogram is a visual blueprint that shows retailers and merchandisers exactly where and how to place each product on a shelf. Without one, products compete for attention chaotically, sales data suffers, and both the retailer and the supplier lose.
In this article we explain what a planogram is, show practical examples for different store formats, describe the main types, outline the principles that make planograms effective, and show how modern software and computer vision help manage them at scale.
Table of Contents
- What is a Planogram?
- What Is a Store Planogram and How Is It Used in Retail?
- What Are Planograms in a Retail Store?
- How to Read a Planogram
- Benefits of Planograms in Merchandising
- Types of Planograms: Formats and Strategies
- Planogram Examples for Different Store Formats
- Principle of a Planogram: What Makes It Effective
- 10 Principles for a Winning Planogram in 2026
- Planogram Software and In-Store Analytics: From Static Diagrams to Live Shelf Data
- How to Use Planograms in Merchandising: Step by Step
- A Good Planogram Is Your Elevator Pitch on the Shelf
What is a Planogram?
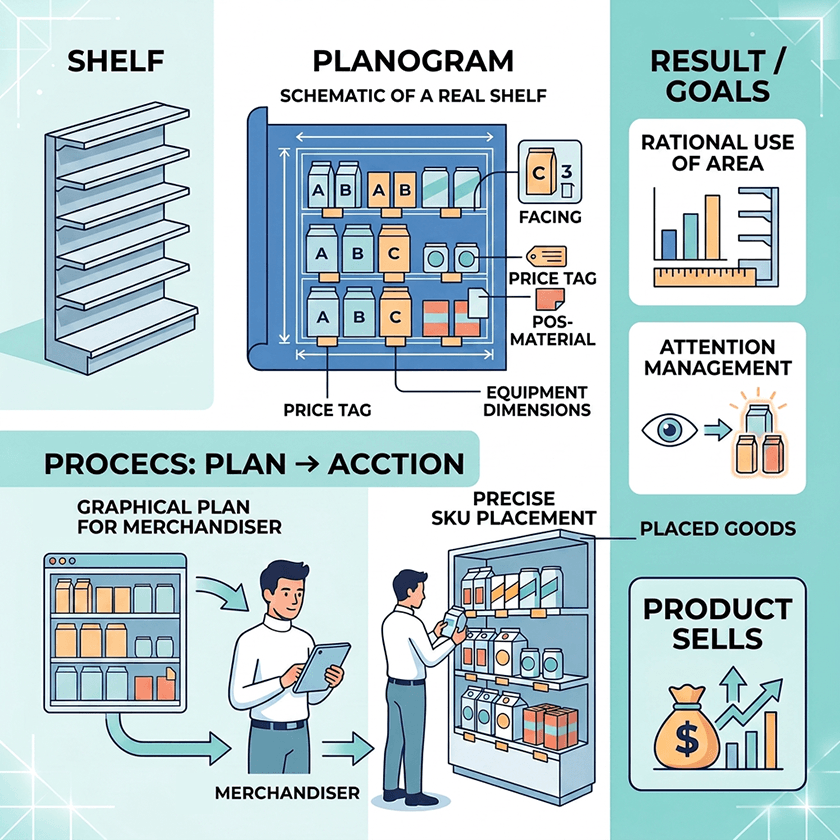
A planogram is a diagram that shows where and how each product should sit on a retail shelf. It defines which SKUs go on which shelf, how many facings each product gets, how products should be oriented, and what should sit next to what. You may also hear it called a POG, a shelf plan, or a space plan.
“Without a planogram, every store and every merchandiser makes their own placement decisions. One location puts the bestseller on the bottom shelf. Another groups products by color rather than by category logic. A third leaves gaps where out-of-stock items used to be. The result is inconsistency across the chain, missed sales opportunities, and a shelf that tells the shopper nothing useful.”

Most successful FMCG companies treat planograms as a core merchandising tool. They are built on data: sales history, shopper behavior, category margins, and brand agreements. A well-structured planogram reflects how the target customer thinks and chooses, and it guides that choice toward the right products.
What Is a Store Planogram and How Is It Used in Retail?
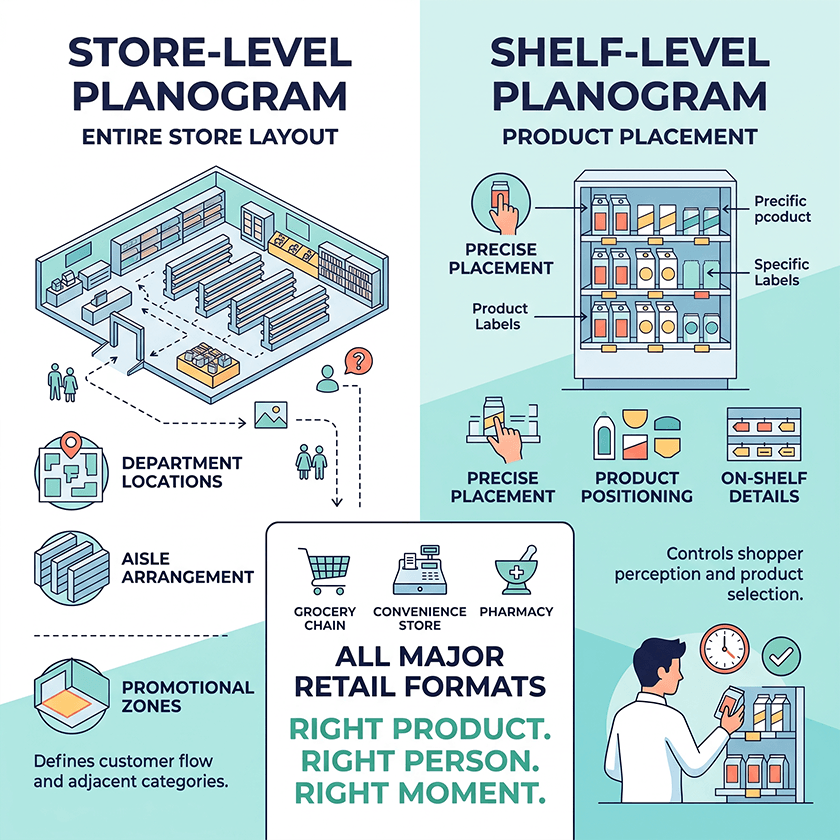
Planograms come in two levels. A store-level planogram shows the layout of the entire store: where departments are located, how aisles are arranged, and where promotional zones and high-traffic areas sit. A shelf planogram shows the precise placement of products on individual shelving units, display racks, or refrigerated cabinets.
Both levels matter. The store planogram defines how customers move through the store and which categories sit next to each other. The shelf planogram controls what the shopper sees when they stop in front of a shelf. Together they shape the physical experience of the store.
Planograms are used across all major retail formats. A grocery chain uses them to manage hundreds of categories across dozens of stores. A convenience store uses them to maximize impulse purchases near the checkout. A supermarket uses them to guide the shopper journey from entrance to exit. A pharmacy uses them to group products by health condition and guide customers to the right solution. In each case the logic is the same: put the right product in front of the right person at the right moment.
What Are Planograms in a Retail Store?
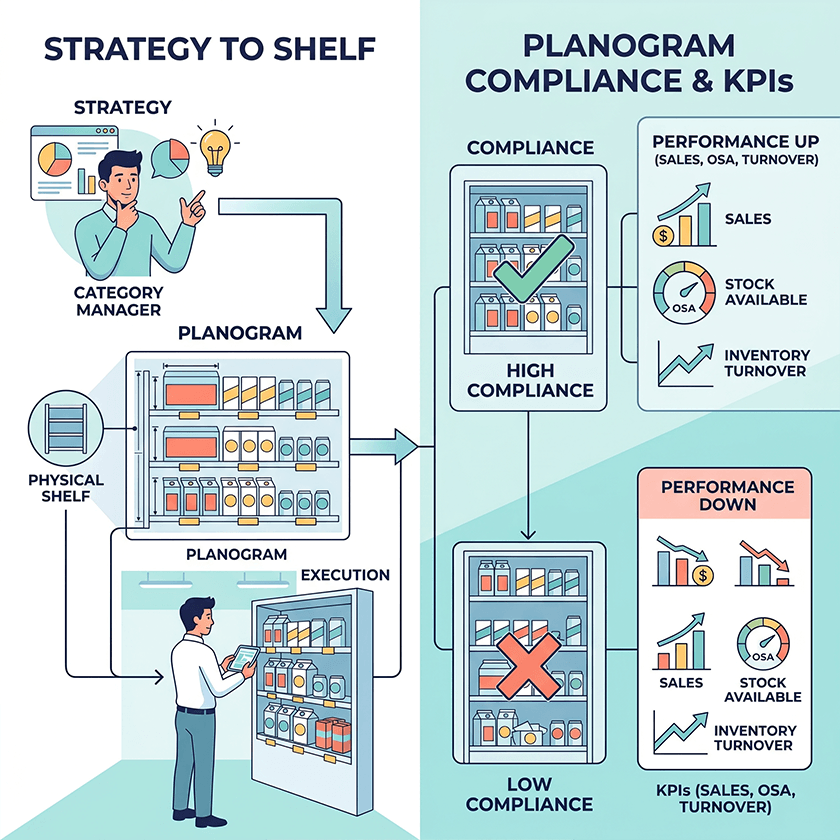
In a retail context, planograms are part of a broader discipline called visual merchandising and space planning. They connect commercial strategy with the physical shelf. A category manager decides which products to carry and in what proportions. The planogram translates that decision into a diagram that a merchandiser can implement in the store.
Key performance indicators tied to planogram execution include sales per square meter, on-shelf availability (OSA), inventory turnover, and planogram compliance rate. When compliance is high — meaning the shelf matches the planogram — these KPIs tend to improve. When compliance is low, even a well-designed planogram delivers poor results.
How to Read a Planogram
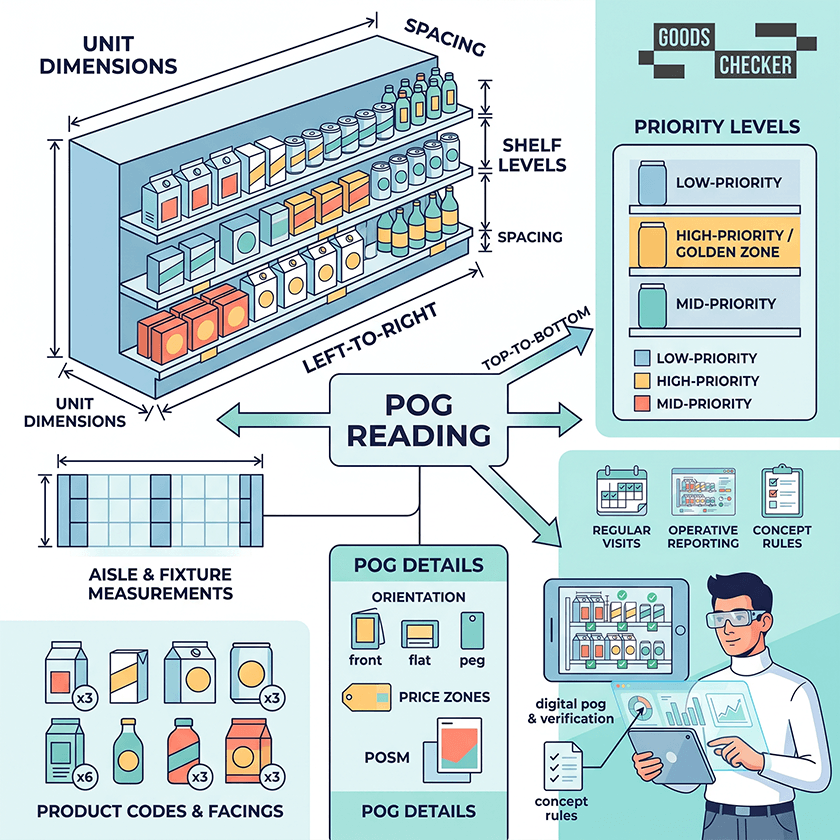
A planogram contains measurements for aisles and shelving units and specifies what kind of display belongs in each area. It includes product images or codes, shelf levels from top to bottom, the number of facings for each SKU, spacing between products, and sometimes additional details like pricing zones or POSM placement.
Reading a planogram from left to right and from top to bottom, a merchandiser can see exactly what goes where. Some planograms also include notes about orientation — whether a product should face forward, lie flat, or be hung on a peg — and indicate which shelf level carries the highest-priority items.
Benefits of Planograms in Merchandising
Planograms bring valuable benefits to everyone involved. Let’s take a closer look at what they deliver for businesses.
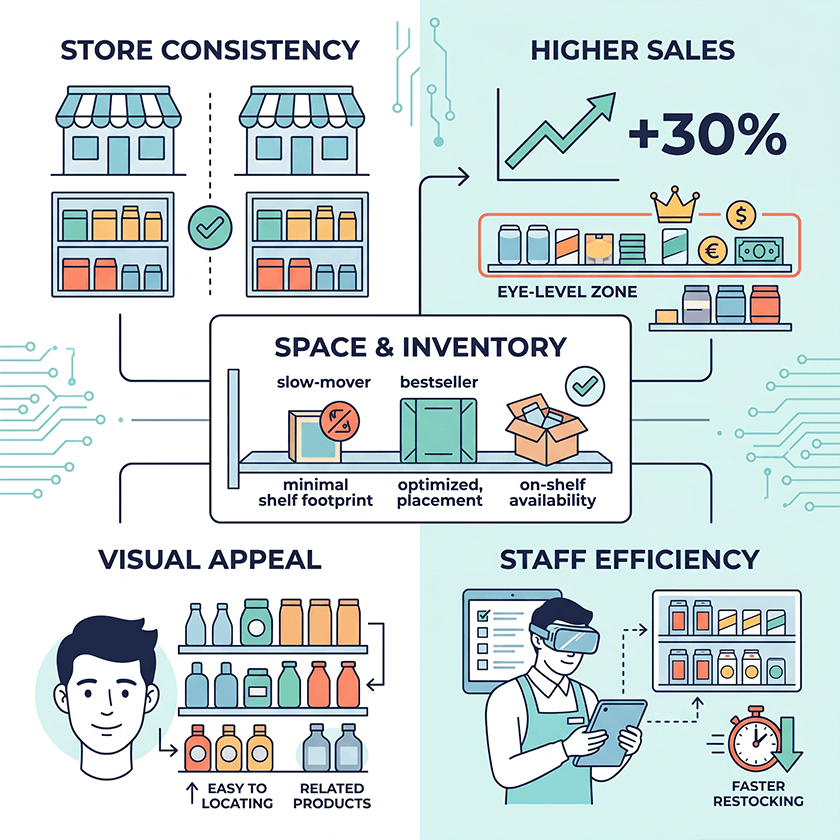
Creating Consistency Across Stores
For retail chains, consistency is one of the most valuable outcomes of planogram use. A shopper who visits different locations of the same chain expects to find the same products in roughly the same place. Planograms make that possible. They also ensure that supplier agreements — such as guaranteed facing counts or placement positions — are honored across every store.
Increasing Sales and Impulse Purchases
Products placed at eye level sell more than products placed on the bottom shelf. Products adjacent to complementary items benefit from cross-selling. Promotional zones near entrances and checkouts drive impulse purchases. Planograms encode all of these mechanisms, turning proven merchandising principles into repeatable instructions. Studies regularly show that well-executed planograms increase category sales by up to 30 percent compared to unstructured placement.
Maximizing Space and Managing Inventory
Retail floor space is expensive. Planograms help ensure that every centimeter of shelf contributes to sales. They prevent overfacing slow-moving products and underfacing bestsellers. By aligning shelf space with actual sales velocity, planograms reduce overstock risk and help maintain on-shelf availability for high-demand items.
Improving Visual Appeal and Customer Satisfaction
A structured, visually coherent shelf is easier and more pleasant to shop. Shoppers find what they are looking for faster and are more likely to discover related products. In pharmacy and health-and-beauty categories, logical grouping by need or ailment significantly reduces shopper frustration and increases basket size.
Improving Store and Staff Performance
Planograms give merchandisers and store staff clear instructions. This reduces the time spent deciding where to put things, speeds up restocking, and makes it easier to train new employees. When a planogram is sent digitally to a store team, the whole setup process becomes faster and more accurate.
Types of Planograms: Formats and Strategies
Planograms vary both in how they represent space and in the commercial logic they apply. Understanding the different types helps teams choose the right approach for each situation.
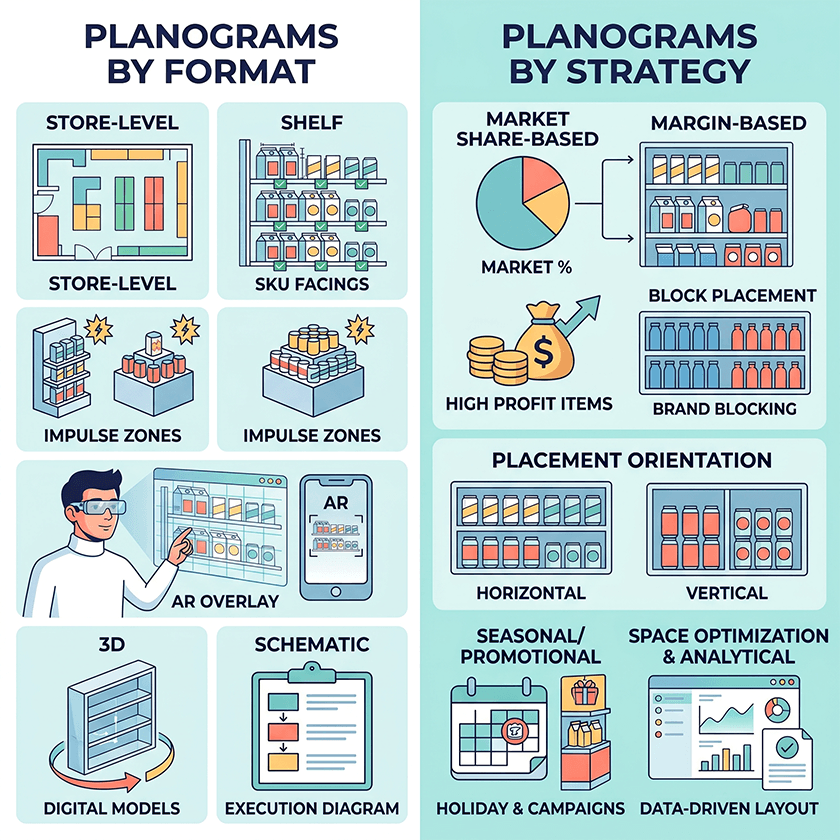
Types by Format
Store-level planograms provide a macro view of the entire floor: departments, aisles, and fixture zones. They are used to plan customer flow, position promotional areas, and ensure consistent layouts across multiple locations.
Shelf planograms are the most widely used type. They show the precise placement of SKUs on individual shelving units, including facings, spacing, and product orientation. They are the primary working document for in-store merchandising.
Display planograms cover secondary, high-impact fixtures such as endcaps, promotional islands, and checkout zones. Their goal is visual impact and impulse purchase rather than routine assortment management.
Text-based planograms predate digital tools and describe product placement in written form. They are largely obsolete in modern retail due to the high risk of interpretation errors and slow execution.
3D planograms offer immersive digital models of shelves and store sections. They are useful for planning new store formats, running layout approvals remotely, and simulating shopper sightlines before physical execution.
AR planograms use augmented reality to overlay digital product layouts onto the real store environment via a tablet or smartphone. They are especially useful for complex resets and new store openings where speed and accuracy are both critical.
Schematic planograms are simplified, execution-ready diagrams created specifically for store staff. They show the essential information — product sequence, facings, key positions — without detailed visual representation, making them quick to use during restocking.
Types by Strategy
Market share-based planograms allocate shelf space in proportion to each brand’s market share. Leading brands get more facings and better positions; smaller brands receive proportionate representation. This approach reflects commercial reality and is common in categories dominated by a few major players.
Margin-based and sales-based planograms prioritize products that generate the highest profit or the highest revenue. Prime shelf positions — eye level, endcaps, first in aisle — go to the items that contribute most to the bottom line.
Block placement planograms group products by brand, creating a clear visual identity for each supplier’s range. Shoppers find it easier to navigate within a brand, and suppliers benefit from consistent brand blocking across the category.
Horizontal placement arranges products side by side across shelf levels, making it easy to compare similar items. Vertical placement stacks related items in columns, which works well for brand towers and for accessibility across different shopper heights.
Seasonal and promotional planograms are time-limited designs built around holidays, campaigns, or special events. They require advance planning but can significantly boost sales of featured products during peak periods.
Space optimization and analytical planograms go beyond layout to incorporate sales data, shopper traffic, and compliance metrics. They are used to evaluate whether a current layout is working and to inform the next round of updates.
Planogram Examples for Different Store Formats
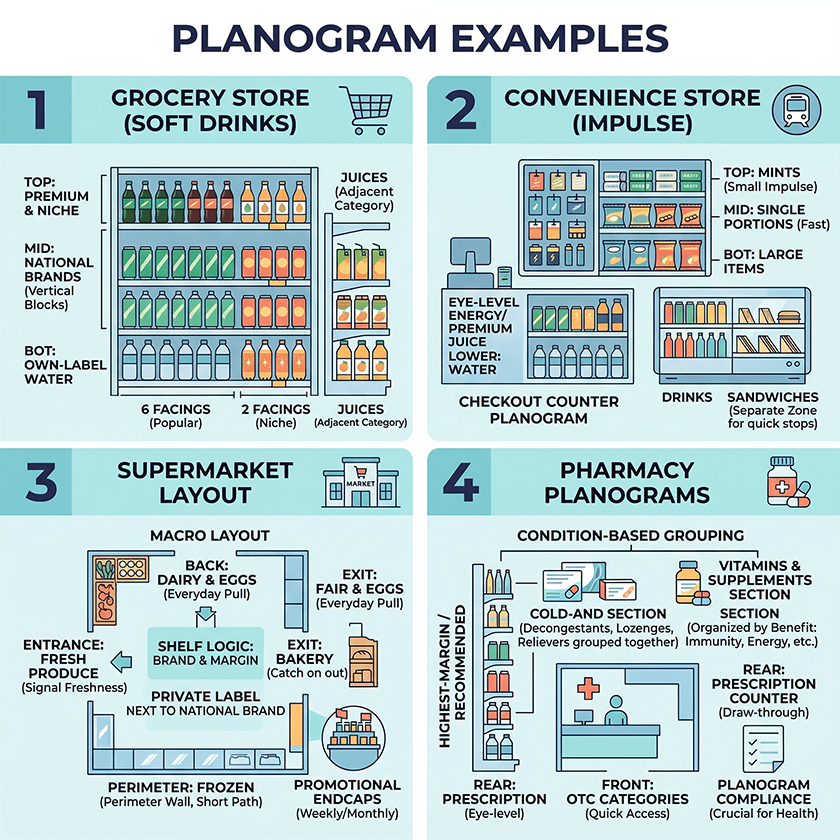
Planograms look different depending on the store format and the category. Here are four examples.
Grocery Store Planogram Example
Consider the soft drinks shelf in a mid-size grocery store. The shelf is four meters wide and has five levels. Own-label water goes on the bottom shelf because it is heavy and shoppers who want it already know where to look. Premium and niche products go on the top shelf. The second and third shelves from the top carry the bestselling national brands. Each brand gets its own vertical block so shoppers can see the full range without moving along the aisle.
Facing counts follow sales data. A popular cola gets six facings while a niche sparkling water gets two. Juices and nectars sit right next to the soft drinks section so shoppers browsing one category naturally notice the other.
Convenience Store Planogram for Impulse Zones
A convenience store near a transit hub runs a very different model. The checkout zone is the most valuable space in the store. The planogram concentrates single-serve snacks, chewing gum, batteries, and small confectionery within arm’s reach of the checkout. Products are placed at three heights: larger items on the bottom, fast-moving single portions in the middle, and small impulse items like mints at the top.
In the chilled cabinet, energy drinks and premium single-serve juices go at eye level and water sits on the lower shelves. Sandwiches and ready meals are grouped together and kept separate from drinks so that shoppers on a lunch break can find everything they need in one stop.
Supermarket Planogram Layout
A supermarket planogram starts at the macro level. Fresh produce goes near the entrance because it signals freshness and sets a positive tone for the rest of the shop. Dairy and eggs are typically positioned at the back so that shoppers coming in for these everyday items pass through other categories on the way. Frozen foods run along one perimeter wall to keep the path from freezer to checkout short. Bread and bakery are placed to catch shoppers on the way out.
Within each department, shelf planograms follow brand and margin logic. Private label products sit next to their national brand equivalents so that price-sensitive shoppers can easily compare. Promotional endcaps rotate on a weekly or monthly schedule and each requires its own display planogram.
Pharmacy Planogram Examples
Pharmacy planograms are organized around health conditions rather than brands. A cold-and-flu section groups decongestants, throat lozenges, and pain relievers together regardless of manufacturer. A vitamins and supplements section is typically organized by benefits such as immunity, energy, or digestion so that shoppers can find what they need without reading every label.
Eye-level shelves carry the highest-margin or most recommended products. Prescription counters are positioned at the rear to draw shoppers through the store. OTC categories like pain relief and allergy sit near the front because shoppers usually know what they need and want to get it quickly. Planogram compliance matters especially in pharmacy because incorrect placement can mislead shoppers about what a product is for.
Principle of a Planogram: What Makes It Effective
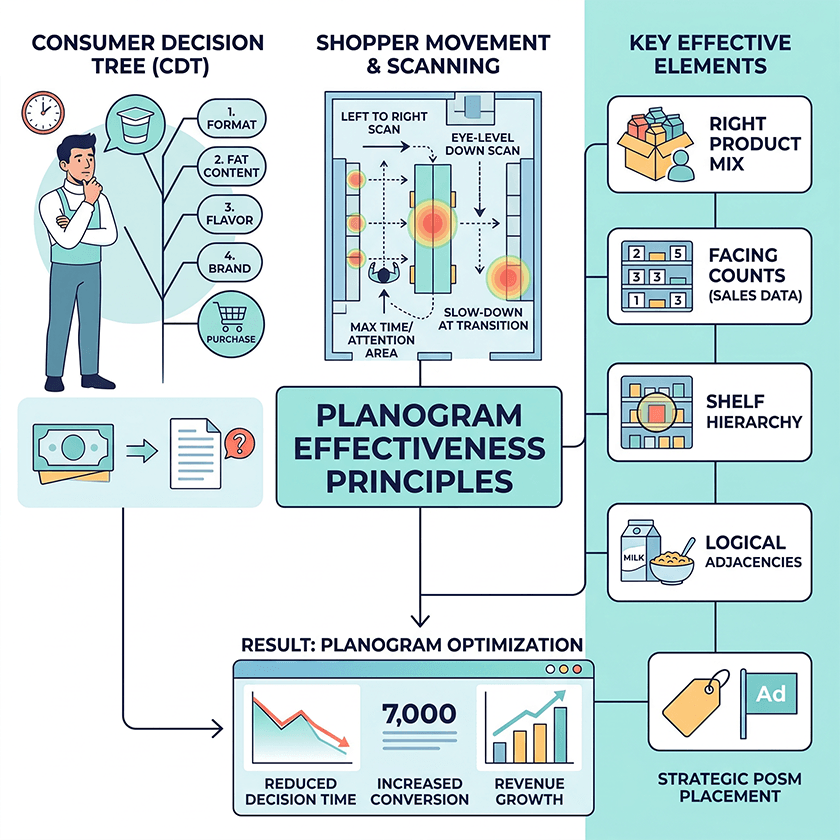
A planogram is a visualization of how the target customer thinks and makes decisions. The most effective planograms are built around the consumer decision tree, or CDT, which maps the sequence of choices a shopper makes when selecting a product in a category.
In the yogurt category, for example, most shoppers first decide on format, then on fat content, then on flavor, and finally on brand. A planogram that ignores this sequence makes it harder for shoppers to find what they want and increases the chance they leave without buying anything.
Effective planograms also reflect how shoppers physically move through a store. In most markets, shoppers scan shelves from left to right and from eye level down. They spend most time in front of the middle section of a shelf and slow down at category transitions. Planograms that account for this by placing priority SKUs at eye level and hero products at the natural start of the scan consistently outperform planograms built on intuition alone.
An effective planogram comes down to a few key elements: the right product mix for the store and the target customer, facing counts based on sales data, a clear shelf hierarchy, logical product adjacencies, and POSM placement that supports rather than distracts from the products.
10 Principles for a Winning Planogram in 2026
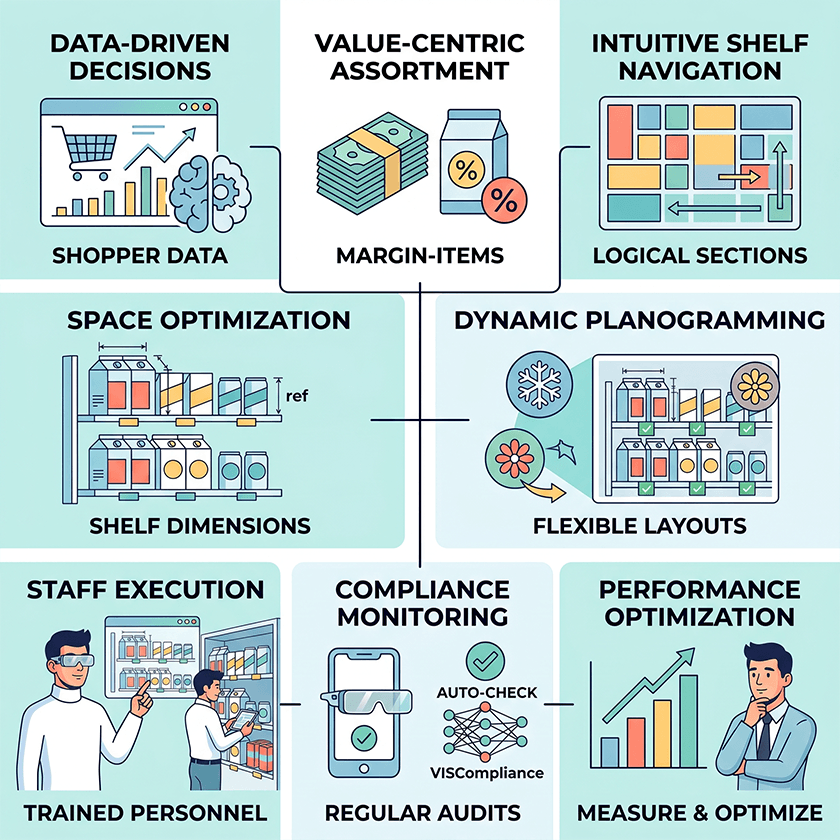
1. Understand Your Customers and Their Decision Tree
Before building a planogram, map how your target shopper moves through the category. What do they decide first: format, flavor, or brand? What triggers an impulse purchase? A planogram built on shopper behavior is far more effective than one built on internal preference or supplier pressure.
2. Use Sales and Shopper Data, Not Gut Feeling
Sales history, store traffic data, and out-of-stock reports should drive planogram decisions. Products that sell well need more facings and better positions. Products that consistently underperform should be reviewed for removal or repositioning. Gut feeling is a poor substitute for data, especially in large chains where small improvements in facing allocation add up to significant revenue.
3. Prioritize High-Value and High-Margin Items
Eye-level shelves, first positions in a section, and endcaps should go to the products that generate the most value for the category. This usually means a combination of high-volume national brands and high-margin private label items. The planogram should make this priority explicit rather than leaving it to individual stores to decide.
4. Create Logical Navigation on the Shelf
Shoppers should be able to find what they are looking for without effort. Build planograms so that related products sit next to each other, complementary categories connect naturally, and the overall layout follows a clear and predictable structure. A shopper who can navigate the shelf quickly is more likely to return and more likely to buy more.
5. Respect Product Parameters and Safety
Planograms must account for the physical properties of every product: weight, size, packaging type, and fragility. Heavy items belong on lower shelves. Tall packaging should not block the view of products behind it. Fragile items need adequate spacing. An impractical planogram will not be implemented correctly no matter how well it looks on paper.
6. Apply Visual Merchandising Basics
Color blocking, consistent product orientation, and logical use of POSM all contribute to a shelf that is visually appealing and easy to read. Vertical brand blocks create a strong visual identity. Horizontal groupings by variant or format make comparison easy. Good visual merchandising makes the shelf do some of the selling before the shopper reaches for a product.
7. Build Flexible, Seasonal-Ready Planograms
Product ranges change and promotions come and go. A planogram that cannot be updated quickly becomes a problem rather than an asset. Build flexibility into the design by identifying which sections of the shelf can accommodate seasonal or promotional products without disrupting the core layout.
8. Train Staff to Read and Implement Planograms
A planogram only delivers results when it is implemented correctly. Store staff and merchandisers need to understand how to read the diagram and what to do when a product is out of stock. Regular training and digital access to the latest planogram version help keep compliance rates high.
9. Monitor Planogram Compliance Regularly
Compliance monitoring means checking whether the shelf actually matches the planogram. Without it, planograms drift over time as staff make small adjustments, products get misplaced during restocking, and promotional items crowd out core assortment. Regular audits, manual or automated, are essential to maintaining the value of any planogram investment.
10. Measure Results and Continuously Improve Layouts
Every planogram update is a hypothesis. Measure the results by tracking sales per facing, category conversion, and out-of-stock rates before and after each change. Planogramming is not a one-time project but an ongoing process of improvement.
Planogram Software and In-Store Analytics: From Static Diagrams to Live Shelf Data
For most of retail history, planograms were printed diagrams posted in the back room of a store. A merchandiser would consult the printout, arrange the shelf, and the process would repeat again. This approach is increasingly inadequate for the scale and speed of modern retail.
What Is Planogram Software?
Planogram software is a digital tool for creating, managing, and distributing shelf plans. Category managers can build planograms from a product database, test layouts digitally, and send plans directly to stores. Modern platforms support 2D and 3D visualization and integrate with sales data and product catalogs.
With planogram software, a layout that used to take hours to create manually can be built in minutes. Changes can be distributed to every store in the chain at once and updates are made centrally rather than store by store
How Computer Vision and In-Store Analytics Close the Loop
The gap between a planned planogram and the actual shelf has always been difficult to measure. Manual audits are slow, inconsistent, and resource-intensive. Computer vision changes this.
With computer vision, a merchandiser takes a photo of the shelf using a standard smartphone. The image is uploaded to the platform, where algorithms analyze it automatically. The system recognizes each product at SKU level, checks whether facings match the planogram, identifies gaps and out-of-stock positions, and generates a report in seconds.
“The result is a shift from periodic compliance checks to near-continuous monitoring. Category managers and field supervisors see the shelf as it actually is rather than as they hope it to be. Issues are identified and corrected faster, and the data feeds back into the next planogram update.”
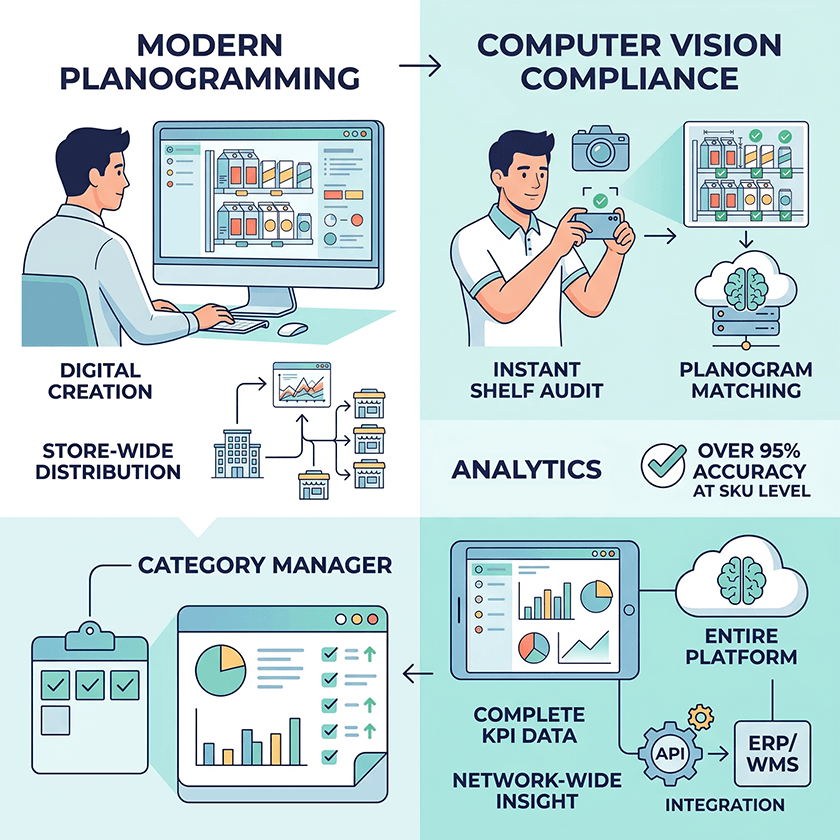
How Goods Checker Helps FMCG Brands Manage Planograms at Scale
Goods Checker is a cloud-based platform that automates the core processes of shelf merchandising. The planogram builder lets category managers create and edit shelf layouts using real product images. Before a planogram is sent to stores, the system automatically checks for common errors such as products placed outside their allocated zone or mismatches between product dimensions and shelf space.
For compliance monitoring, Goods Checker compares photos taken by merchandisers against the target planogram. The system identifies which products are present, how many facings each has, and whether any positions are empty. Recognition accuracy exceeds 95 percent at SKU level and results are available within seconds of a photo being submitted.
The analytics module generates reports by store, region, category, and time period. KPIs including planogram compliance rate, on-shelf availability, and facing count can be tracked across the entire network. This gives retailers and suppliers a shared, objective view of shelf execution rather than relying on self-reported data.
The platform integrates with existing IT systems through API so data flows between Goods Checker and ERP, WMS, or sales reporting tools without manual export. Field teams use the same mobile application to submit photos and access planograms, so the technology adds capability without adding complexity to their workflow.
How to Use Planograms in Merchandising: Step by Step
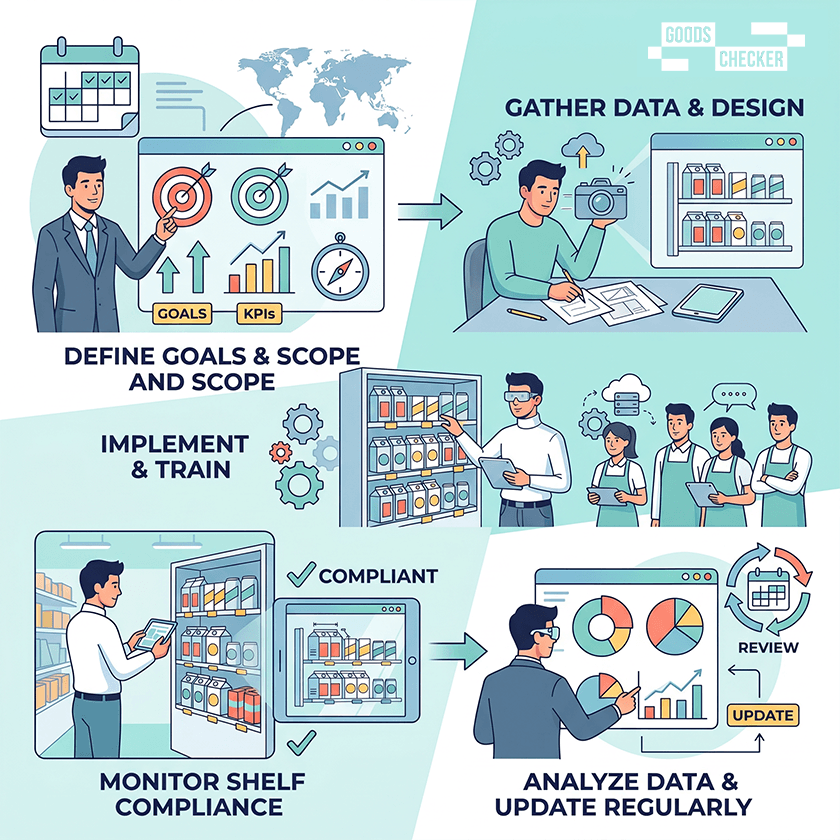
Step 1. Define Goals, KPIs, and Scope
Before building a planogram, clarify what you are trying to achieve. Is the goal to increase category sales, improve compliance, or support a new product launch? Define the KPIs that will measure success and identify which store formats, categories, and regions the planogram will cover.
Step 2. Gather Data and Create the First Planogram
Pull sales data, facing counts from existing shelves, shopper research, and product dimensions. Start with the highest-impact decisions: which products belong at eye level, how much space each brand gets, and how categories connect. Digital planogram tools make this process faster and allow you to test different versions before committing.
Step 3. Implement the Planogram and Train Staff
Distribute the planogram to stores digitally and make sure merchandisers and store staff understand how to implement it. Provide clear instructions for common situations such as what to do when a product is out of stock or how to handle a new product that was not in the original plan.
Step 4. Monitor Planogram Compliance and Shelf Execution
Conduct regular checks to verify that shelves match the planogram. Use photo-based audits and automate the analysis with computer vision tools where possible. Identify the stores and categories where compliance is lowest and prioritize corrective action there.
Step 5. Review Sales and Shopper Data, Then Update Regularly
After a planogram has been in place long enough to generate reliable data, typically four to eight weeks, review the results. Which products underperformed despite their position? Use the answers to refine the planogram and start the cycle again.
A Good Planogram Is Your Elevator Pitch on the Shelf
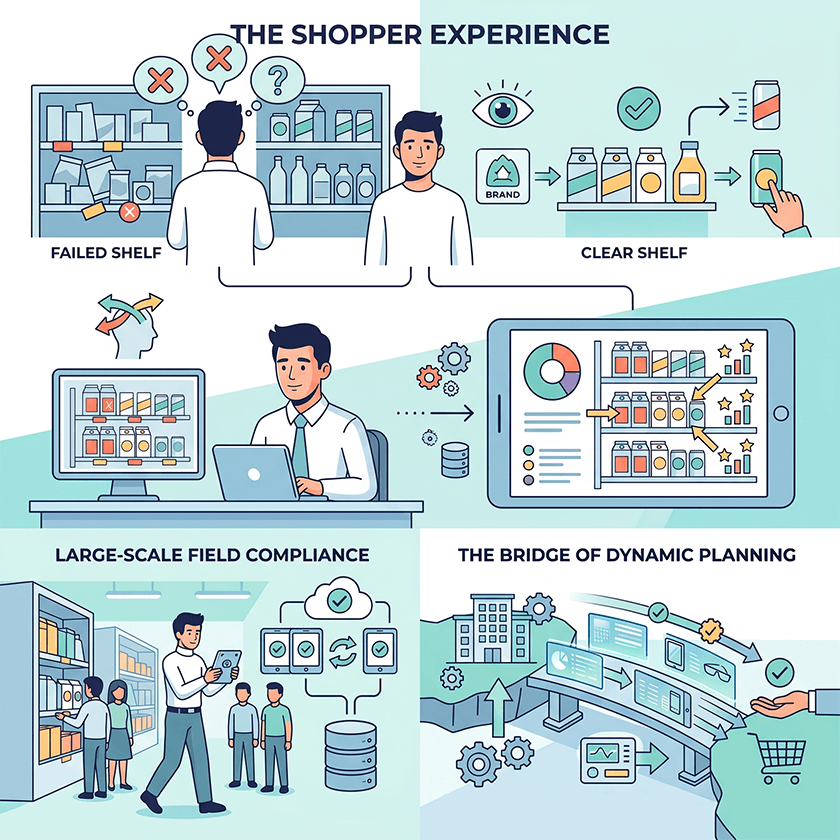
When a shopper stops in front of a shelf, they give it a few seconds. In those seconds, the planogram either communicates something clear or it fails. A well-designed planogram says: here is the brand, here is the range, here is the product for your need. A poorly designed one says nothing in particular.
The companies that win on the shelf combine solid merchandising principles with real data and digital tools. They know which products deserve eye-level placement and why. They track compliance at scale without overwhelming their field teams. They update planograms based on what the data shows rather than on assumptions.
The planogram has always been the bridge between commercial strategy and the shopper’s hand. Modern tools make that bridge faster to build and easier to maintain.