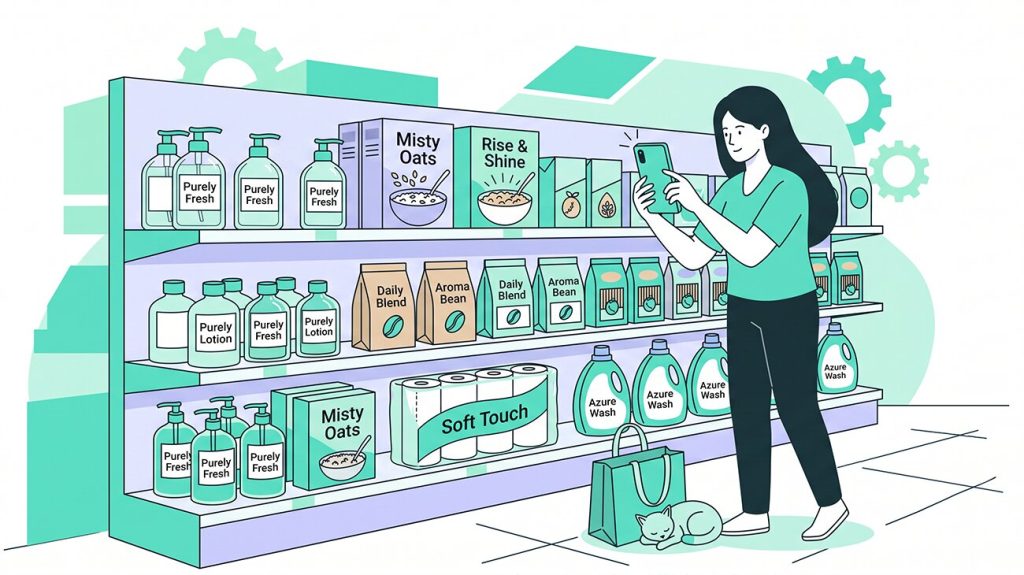


Shoppers compare prices on the shelf, and when quality is comparable, they usually reach for the cheaper option. A 5–10% gap within a category is often enough to swing the decision, so manufacturers and distributors track competitor prices constantly to fine-tune their own pricing and time their promotions. The problem is that the data reaches the marketing team late. Field reps walk the stores, photograph price tags, send the images over messenger, and analysts sift through the photos by hand. The whole cycle takes three to five days — and the competitor keeps winning sales the entire time.
In this article, we’ll look at what competitor data companies actually need to collect, why manual price monitoring falls short, and what changes once you automate price tag recognition and analysis.
Table of Content
What Competitor Price Tags Can Tell You: Three Kinds of Data
Companies often boil competitor monitoring down to tracking prices. These days, that’s not enough. To stay competitive, FMCG companies need to watch three types of information at once.
Price movements. A price tag shows more than what a product costs right now — it shows how a competitor manages pricing. Collect the data regularly and patterns emerge: whether they hold prices steady or cut them at the end of the month, whether they discount continuously or in waves. Regional differences matter most of all, because competitors often test low prices in one market before rolling them out nationally. Spot those tests early and you can respond before the new pricing spreads across the country.
Product assortment. Because price tags carry product names, shelf photos reveal not just prices but the competitor’s full lineup and country of origin. You catch a new product on its first day on the shelf, not weeks later in an analyst’s report. The number of tags in a category tells you how many SKUs a competitor carries and which categories they’re expanding or pulling back from. If a competitor launches a line you don’t offer, that’s a signal to check whether the demand is there. Or maybe they’ve simply switched where a product is made.
Promotions. Promotional tags look different from regular ones, so photos show which categories a competitor is pushing and how long the discounts run. Monitor promotions continuously and you’ll see when they kick off campaigns and which products get the seasonal spotlight. Companies use this to plan their own activity — deciding whether to run a promotion at the same time or hold off and launch later, after the competitor wraps up and the discounts clear off the shelf.
How Companies Track Competitor Prices Today
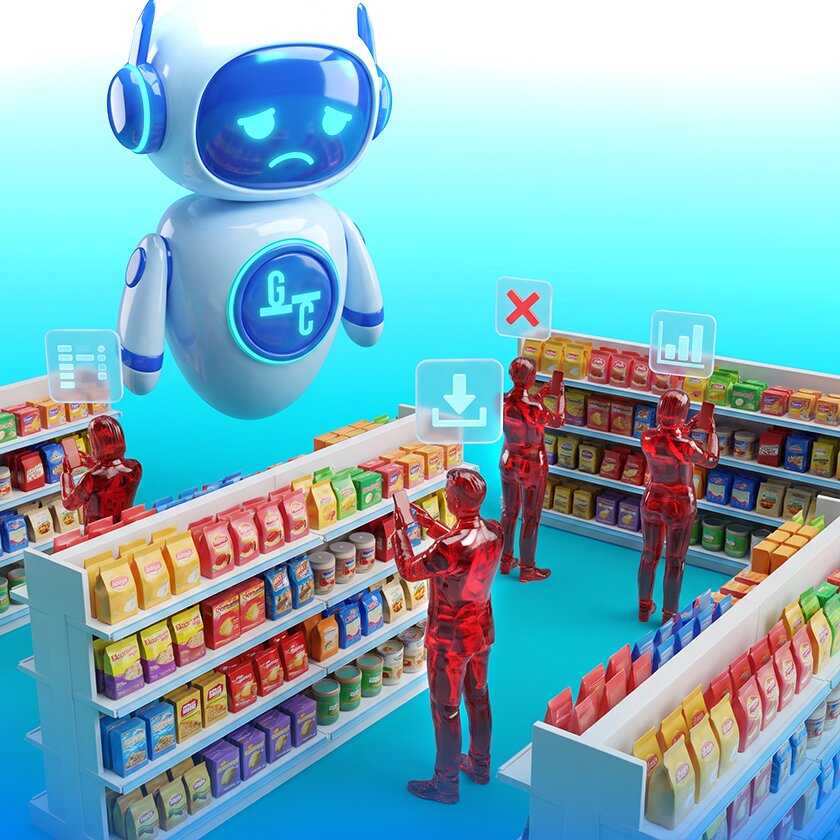
Most companies still collect competitor prices by hand. Field staff visit stores, snap photos of price tags on their phones, and drop the images into a shared chat or folder. Analysts open the photos, key the numbers into a spreadsheet, and roll everything up by category and retail chain. Only then does marketing get the full picture and decide whether to move on its own prices.
When dozens of employees cover thousands of stores, that cycle stretches to five days. The competitor keeps selling the whole time, shoppers adjust to the new prices, and the manufacturer only reacts after part of the category’s sales have already slipped away.
The second issue is accuracy. When people handle incomplete data, errors creep in. A rep misses a tag, skips a category, or mistypes a number — and marketing has no way of knowing what’s missing from the report or how reliable it is.
The third issue is scale. More stores mean more people on the ground, and covering a thousand locations every week takes dedicated headcount. So companies settle for a sample — a few dozen stores and one or two categories — and leave the rest of the market in the dark. Hiring an agency is the alternative, but it costs even more and still limits how much ground you can cover.
What Automated Price Tag Recognition Delivers
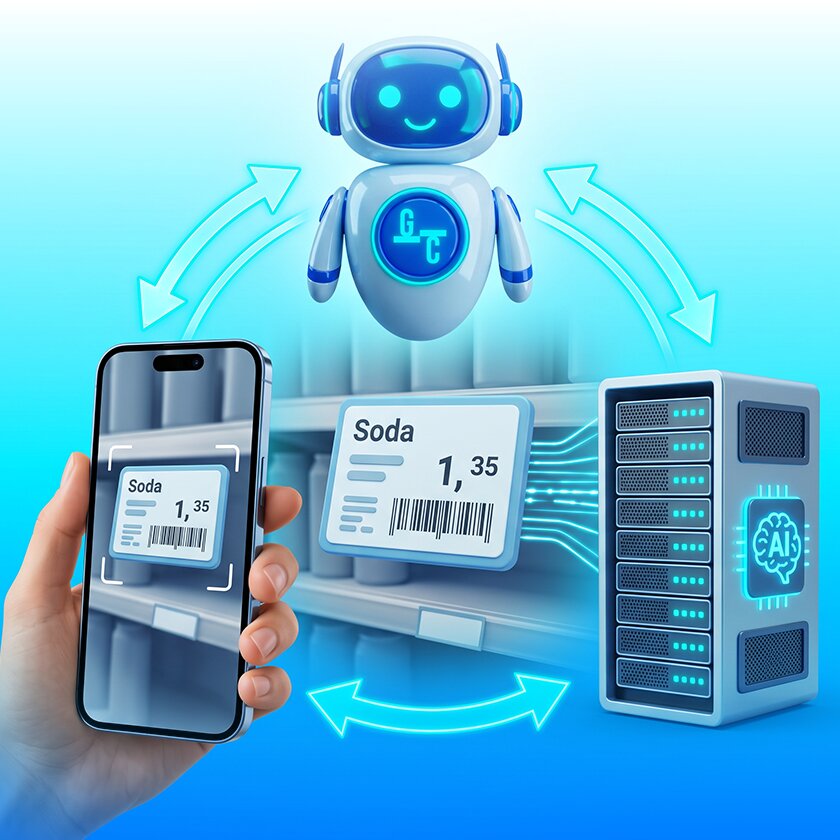
Automated recognition takes manual photo review off the table. Here’s how it works, using Goods Checker as an example.
A field rep photographs competitor price tags in the target category. The app uploads the images to a server, where neural networks read everything on the tag: price, product name, country of origin, barcode, promotion flag, and more. The data flows into the analytics dashboard while the store visit is still underway, so marketing sees price changes and other shifts in real time.
The system processes every tag, so the data comes in complete and free of manual entry errors. From there it rolls up into detailed reports — by store, chain, category, product, and rep — and managers can analyze it and compare it against previous periods.
Photographing a shelf takes two to three minutes, so reps capture it during a routine store visit. No special trips just to check competitor prices.
How Pricing, Assortment, and Store Decisions Change After Automation

Faster, more complete data changes how companies make pricing and assortment calls. Three scenarios show what that looks like.
Local price adjustments. A competitor drops prices in one region and leaves the others alone. You catch the difference the same day and can, for example, match the cut only where it happened — instead of sacrificing margin in regions where nothing changed.
Responding to competitor launches. The system checks the names on the tags against your list of known competitor products and flags anything it hasn’t seen before. You learn about a new product in its first days on the shelf, gauge the demand, and respond before the competitor locks up shelf space in that category.
Wider coverage, faster data. Automation lets a single manager cover far more stores than manual monitoring ever could. And you can push coverage and speed even further by bringing store staff or trade reps into the price-collection process.
Competitor Monitoring Becomes Part of the Store Visit
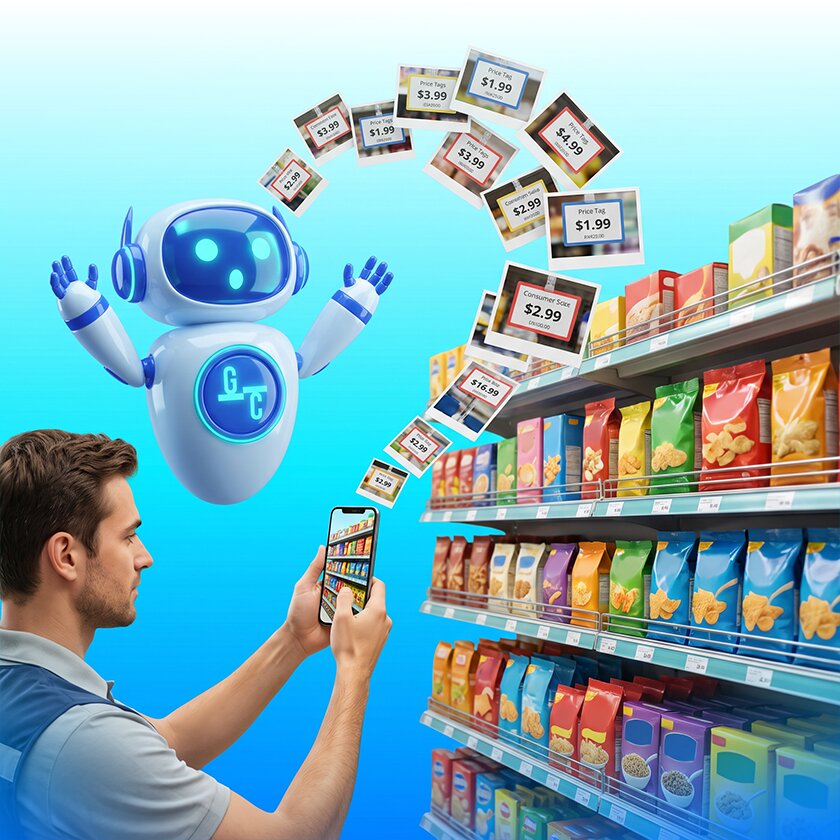
For a long time, collecting competitor prices was a standalone job with its own visit schedule and its own staff. Automated recognition folds it into a normal merchandiser visit without adding time in the aisle. You get competitor pricing, assortment, and promotion data the same day the rep photographs the shelf.
And costs don’t go up. Merchandisers visit the same stores on their existing schedule, and photographing the tags adds two to three minutes per stop. No extra staff for the job, and as the store count grows, the analysts’ workload stays flat because the photos process themselves.
You no longer have to choose between coverage and speed. Where you once sampled a few dozen stores and a single category, you can now monitor the entire network — and make pricing decisions before the category’s sales start shifting to the competition.