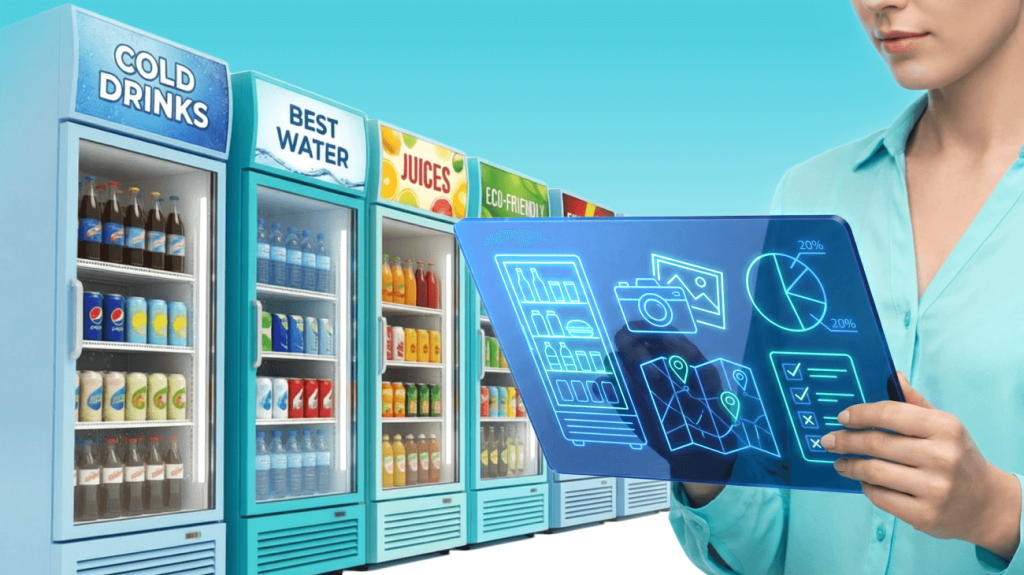

Placing goods in your retail space may seem simple. But in fact, this is a complex and intentional process that helps manage people’s attention, forcing them to purchase the right products and make impulse purchases.
This article will explore the role of planograms in this process, their types, and methods to create an effective planogram. Most of the successful FMCG companies use planograms as an important tool to maximize sales. This article also describes a special planogram software that helps to create planograms, check the correct layout of goods on the shelf and optimize the merchandising processes.
Table of Сontents
What is a Planogram?
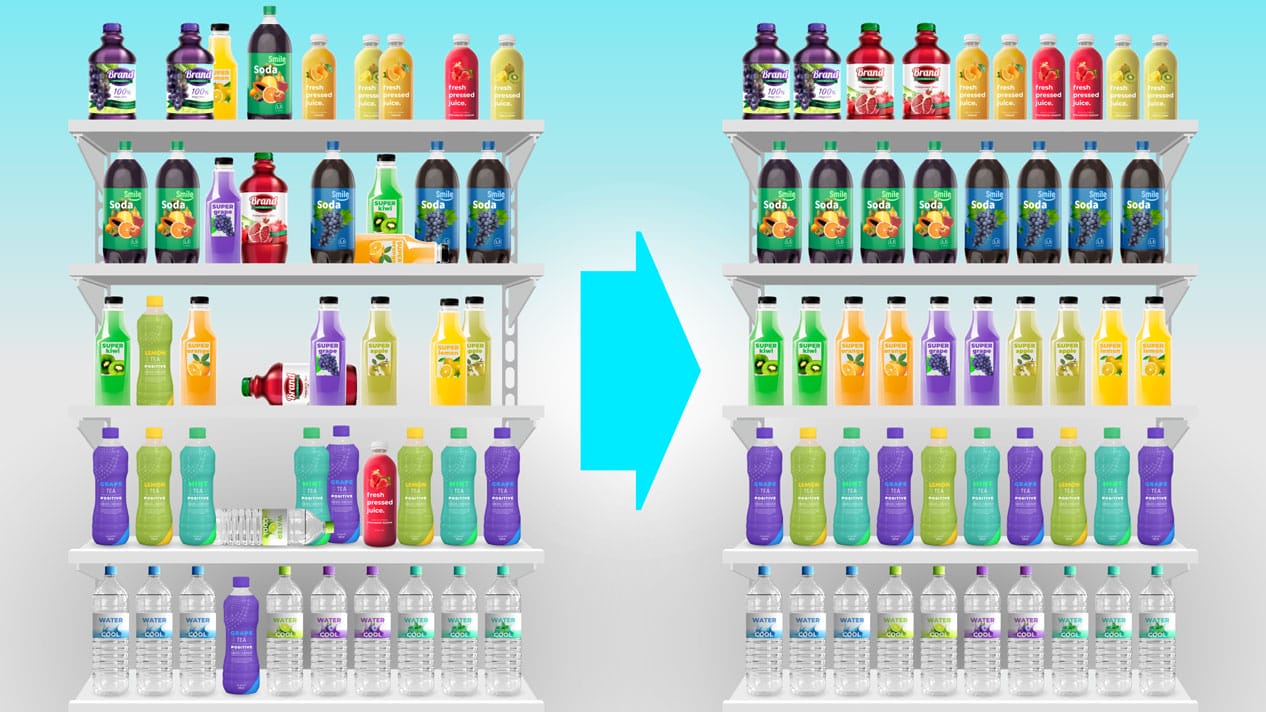
A planogram is a tool that FMCG companies and retailers use to visualize the arrangement of products on store shelves. The planogram is generated based on an analysis of consumer demand and store layout, product characteristics, agreements with counterparties and basic merchandising principles.
Planograms were usually created manually in Microsoft Excel, with one SKU per cell. But over time, the layout became more complicated, the requirements for the document became higher, and special-purpose planogram tools were developed to generate planograms.
Why FMCG Companies and Distributors Use Planograms?

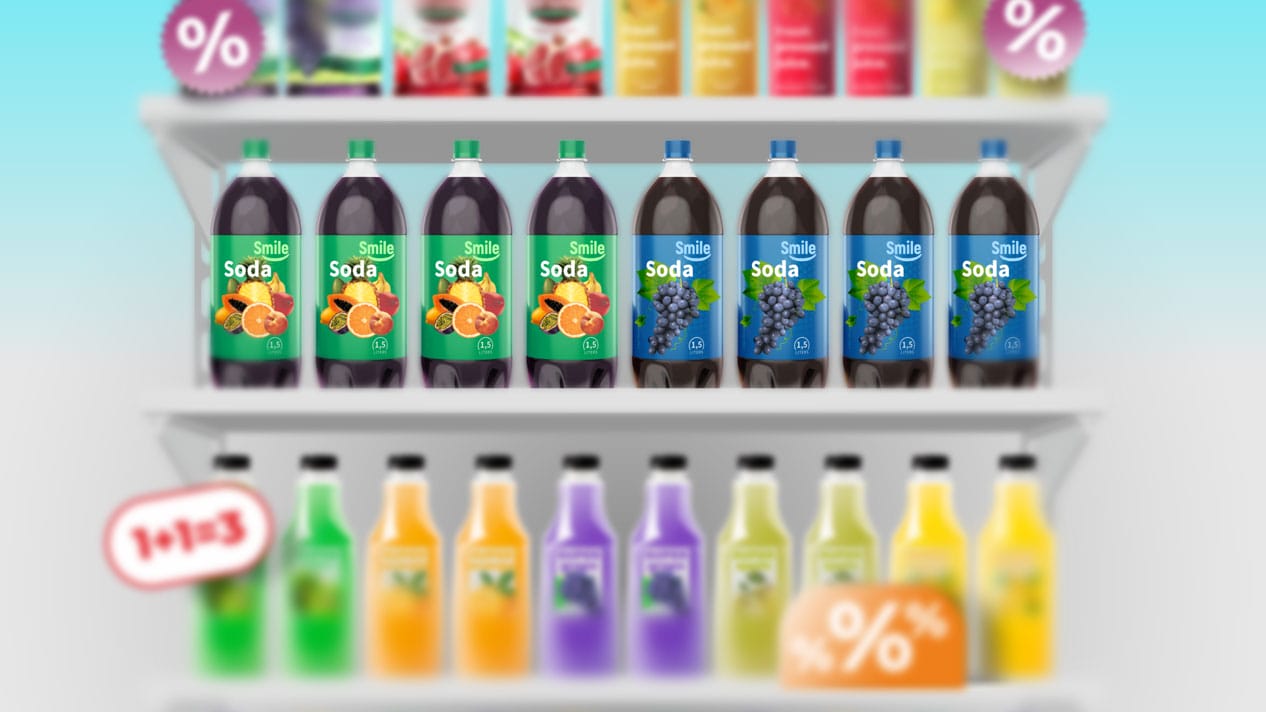
Much of the success of FMCG companies and their distributors depends on how they use planograms, how well they can display their goods in stores. For example, during holidays such as Halloween, candy gift sets should be placed in a better position. With planogram implementation, FMCG companies increase the number of impulse purchases and product turnover.
Continuous analysis of planograms, display and demand provides understanding of which product sells better and why, why the product is not selling, which outlet yields more profit, whether counterparties comply with agreements, how promotions, POS materials and other marketing activities perform.
A well-designed planogram and display in accordance with it allow brands to stand out among other products and maximize sales.
Here are several examples how properly designed planograms influence business indicators of companies. A Czech pharmacy chain introduced a system of individual planograms adapted to each sales outlet. This approach effectively solved the problem of dead stock, optimizing the remaining goods in the pharmacies. A FMCG company used special software to automate merchandising and create planograms. This made it possible to reduce the total number of required planograms by 77% and resulted in a significant growth of sales in the tested goods categories by 8%.
Types of Planograms
Planograms are made based on different indicators, depending on the company’s goals and store layout.
Based on market share. The larger the market share a product occupies, the better positions it gets. This is one of the most popular product presentation strategies.
Depending on profitability. Each manufacturer generates a different margin on its products. Therefore, retail can give better positions to those goods that bring it greater profit. This type of planogram is most often used in small stores.
Depending on commercial status. In this case, larger and more well-known brands get more advantageous places in stores.
Block arrangement. Products are arranged into categories without regard to share or brand. This is convenient for buyers, as they can immediately see all brands and compare them with each other. Block arrangement can be horizontal or vertical. With a horizontal planogram, different brands are placed on one shelf, with a vertical planogram — on different ones.
What Makes a Planogram Effective
A planogram is a diagram of a real shelf, so it must take into account and display all the elements of the shelf: equipment size, shelf labels, and POS materials.
A planogram is considered effective where it differentiates a product from competitors and encourages impulse purchases. To create an effective planogram, it is necessary to determine which categories and SKUs in the FMCG company’s product range are priority ones and they should be presented in the most advantageous positions in the layout to maximize sales.
An effective planogram must also be realistic and feasible within the conditions of a specific store. It is important to consider the specifics of sales equipment, consumer behavior in the location, and seasonal factors. Research demonstrates that correct placement of goods taking into account consumer path may increase sales of some items by up to 30%.
Five Principles for Creating a Planogram
Whether created manually or with planogram software, a planogram should be based on five basic principles.
1. Abundance. This means that the entire active range of products should be presented in retail outlets, taking into account the share of sales of each category, demand and sales, sales area, equipment, seasonality and other factors. The primary objective is to present all items in retail outlets and determine the required number of facings for each SKU.
2. Visibility. The better a product is visible, the more attractive it looks compared to competitors, the more likely it will end up in the buyer’s basket. When creating a planogram, one should take into account the arc of vision, product packaging, and wisely select POS materials. It is also important to remember about the placement of goods at eye level.
3. Consistency. According to this principle, products that complement each other are grouped together. Example: pates and cold cuts are successfully placed next to cheeses, or tea/coffee is placed next to sweets.
4. Compatibility. The principle of consistency is complemented by the principle of compatibility. This means that there should be no products displayed nearby that could negatively affect neighboring groups. This includes both customer misperceptions and food spoilage. For example, loose cereals and meat cannot be placed nearby, as cereals absorb odors. This principle helps to follow sales and logistics requirements.
5. Efficiency. This principle is the balance between costs and profits. The principle is met when, after the implementation of planograms, the level of sales and turnover of goods increase.
Trends in planogram development
The world of retail trade is constantly evolving, and so do the approaches to creating andn using planograms. Let us consider the main trends that will define the development of this field in the near future.
Customization of planograms for different sales networks and locations
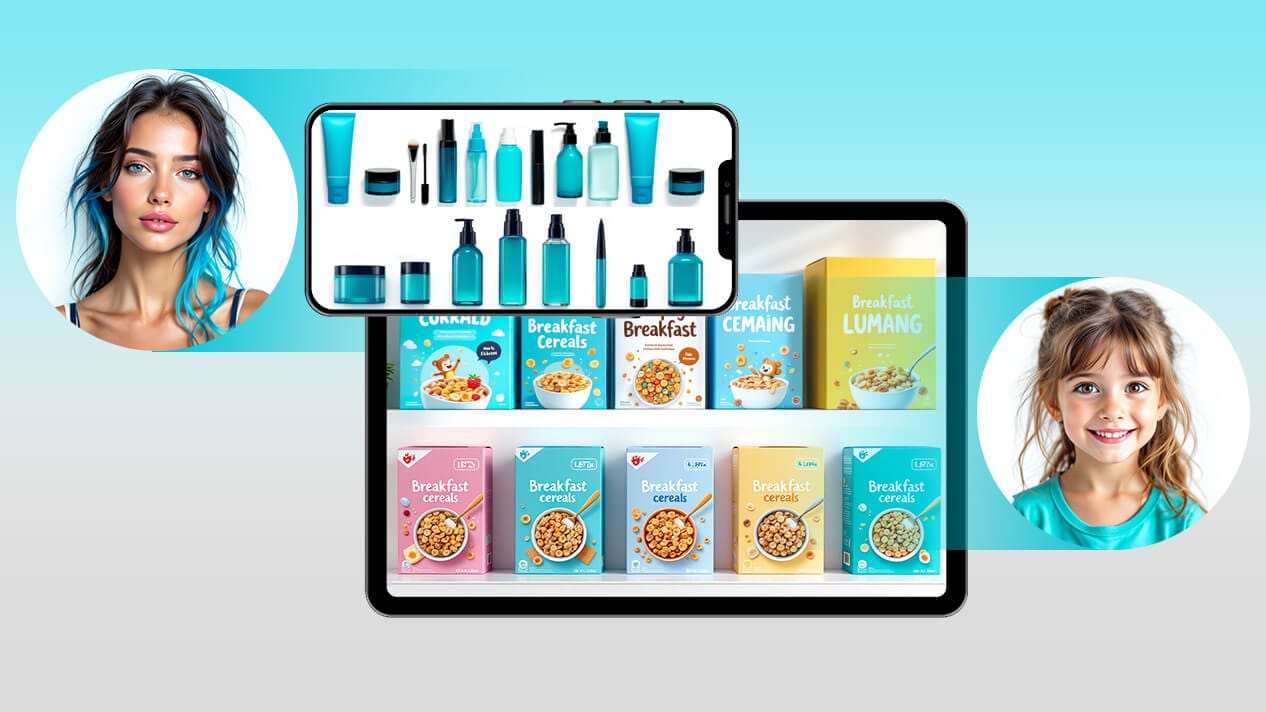
Modern retailers steer away from one-size-fits-all planograms for all stores of the chain. Instead, they adapt the arrangement of goods to the specifics of each sales network and sales outlet, taking into account demographics of the region, purchasing power of the population, and even climate specifics. For example, in areas dominated by young families, more attention is given to children’s goods and instant foods, while the districts with high density of office workers see an increase in the quantity of ready-made food and premium products.
Dynamic planograms and seasonality considerations
Static planograms are becoming a thing of the past. They are being pushed out by dynamic models that involve regular updating of the goods displaly depending on the season, holidays, or special offers. Modern IT solutions make it possible to quickly create a calendar of planogram updates and automatically remind the staff about the required changes. This approach allows for maximising the use of seasonal sales peaks and minimizing losses during the low season.
Integration with consumer behavior data
The analysis of buyer behavior is becoming a key factor in creating effective planograms. Modern technologies make it possible to track the movement of customers in the store, the time spent at various shelves, and the order of selecting goods. These data are used as a basis of heat maps of the store that demonstrate the most and the least popular areas. This makes it possible to optimize the placement of goods, increasing the time of consumer contact with the goods of the highest margin.
Omnichannel approach to planograms
With the spread of e-commerce, many retailers actively develop the omnichannel approach, according to which planograms of physical stores are coordinated with the organization of the online catalog. This unifies the user experience and facilitates navigation for both online and offline buyers. Within the framework of this trend, special attention is paid to the areas of issuing online orders in physical stores and integrating them into the common concept of sales space.
Environmental friendliness and sustainable growth
Modern consumers are paying more and more attention to environmental safety and sustainable growth. This trend is also reflected in the planograms, where special areas are created for environmentally friendly goods, products with a minimal carbon footprint and goods from local producers. Correct positioning of such goods within the planogram helps retailers attract environmentally conscious buyers and boost the brand image.
Consideration of these trends in the development of planograms allows retailers to remain competitive in a rapidly changing environment and satisfy the needs of modern buyers to the maximum possible extent.
Best Planogram Software for Creating Planograms
Planograms are often created in regular MS Power Point or MS Excel. Typically, these are ordinary spreadsheets with product names written in cells. With this approach, products can easily be confused with each other, since SKUs from the same product line differ slightly. As a result, a well-written program does not work in real life, and reports show an incorrect picture.
To address this problem and improve the usability of planograms, IT companies have developed special-purpose planogram software, like Goods Checker.
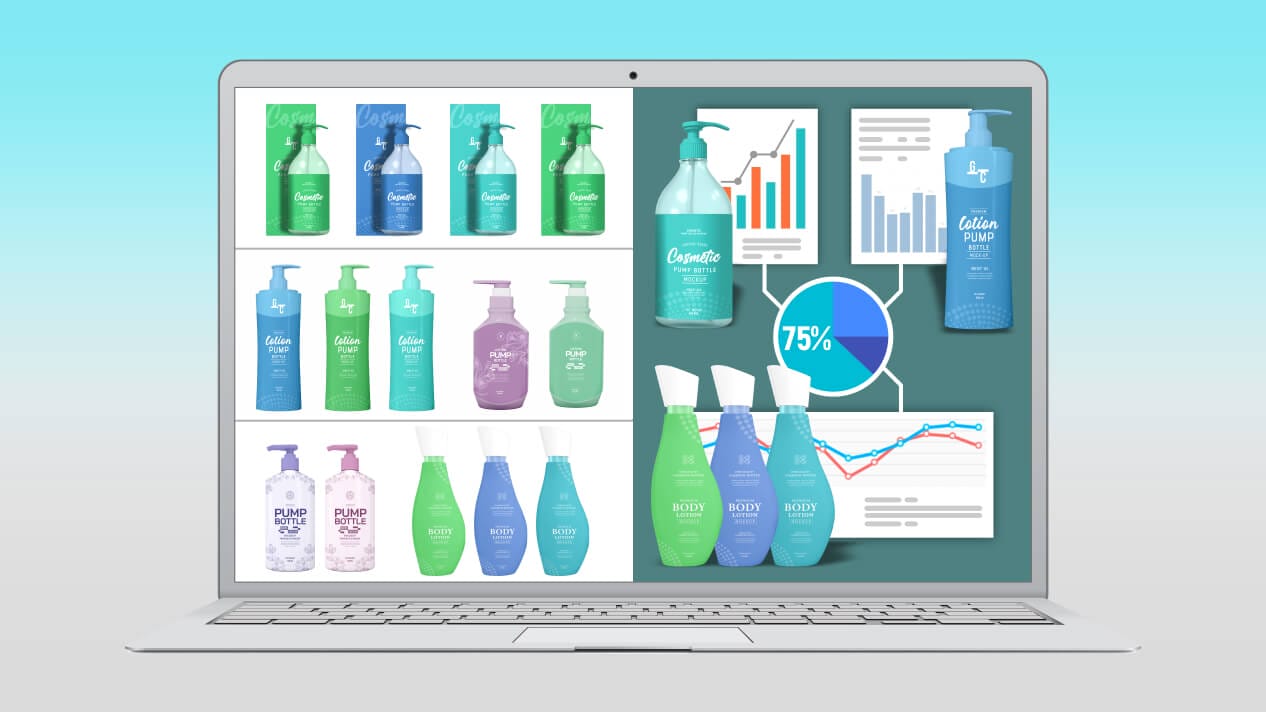
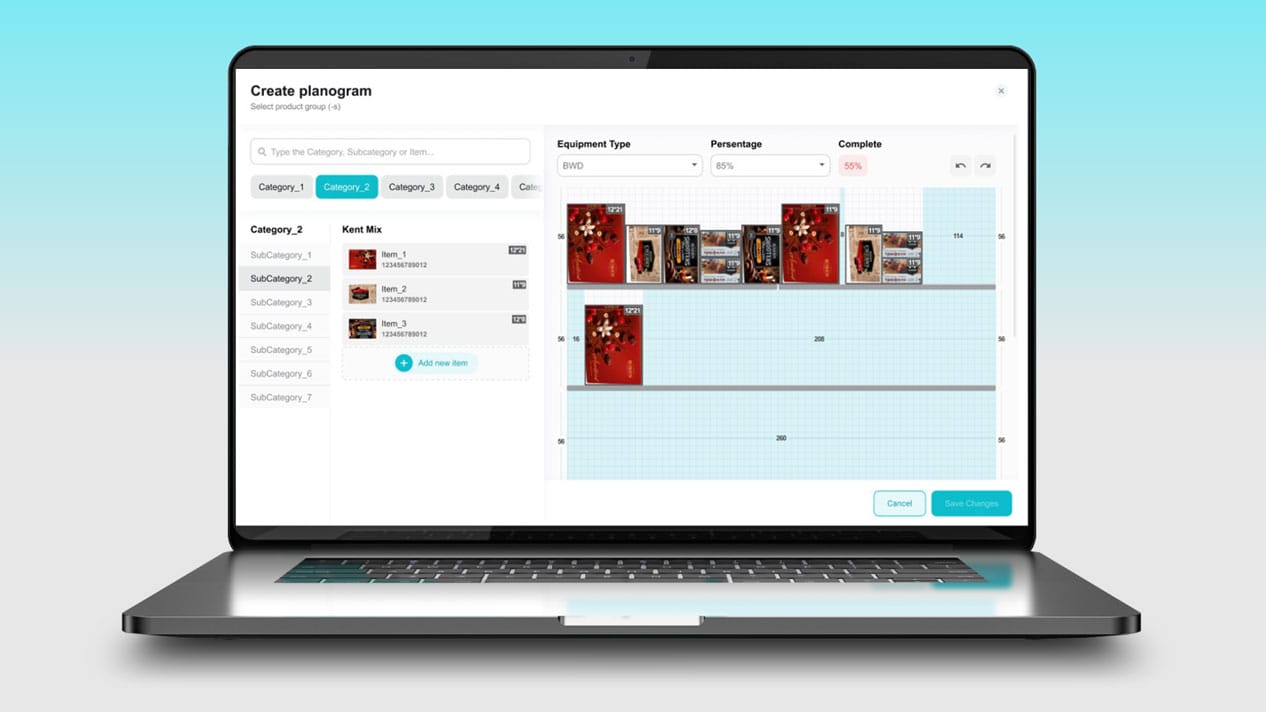
Goods Checker is an AI-powered IT solution designed for automating planogram merchandising processes. The solution helps generate planograms, easily edit them, check the correct layout of goods on the shelf, and obtain detailed retail analytics.
Goods Checker has a designer module where you can create electronic planograms. With this module, planogram creation with images of dozens of SKUs takes just a few minutes. This approach will help to present products realistically, taking into account the size and features of commercial equipment.
With planogram software Goods Checker, managers, in turn, do not need to sort photos manually — they can spare more time to review retail analytics, and merchandisers can immediately determine which products are placed incorrectly.
Benefits of Goods Checker:
- Generates planograms faster than Excel or PowerPoint.
- Convenient approach to handling planograms with a large number of points of sale and types of equipment.
- Easy-to-use category tree.
- User-friendly interface to quickly add new products and equipment.
- Checking the planogram data for correctness: products in the air, overlapping products, wide product on a narrow one).
Good Planogram is a Key to Successful Sales
A planogram is a map that shows the exact location of each product. Planogram execution is a strategic process that determines how well your product will be visible on store shelves and whether the buyer will pay attention to it.
The main purpose of the planogram is to encourage consumers to make impulse purchases, so it is important that the display corresponds to the well-developed planogram. To do this, it is necessary to streamline the comparison of layout against the planogram to the greatest possible extent and use modern and best planogram software.
Besides, planogram software helps managers and executives to receive up-to-date and aggregated data from stores in due time. Thanks to instant data business can increase the percentage of layout compliance with planograms and track the reasons why planograms are not observed: out of stock, broken equipment, etc.
Thanks to planogram software businesses can create an effective planogram, optimize planogram management, improve merchandising efficiency, and redefine the shopping experience for consumers.