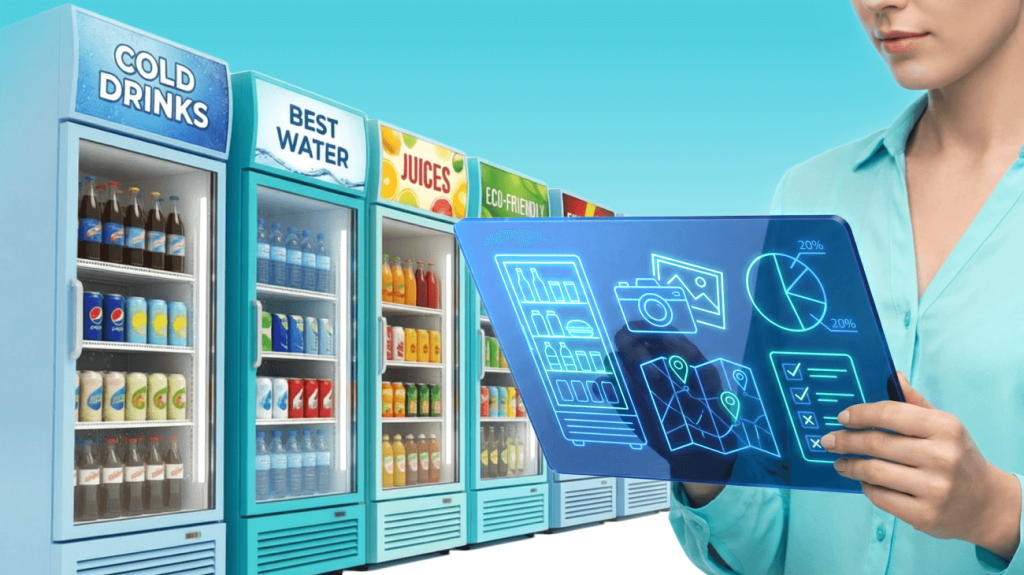

Manufacturers collect a large amount of information from suppliers, stores, merchandisers. But this data helps to evaluate the production (manufacturer) efficiency and benefit the business only when it is correctly analyzed by the company: the necessary metrics are monitored and there is an understanding of what the data shows, together with an answer to the question “why this happened”. This approach to FMCG analysis allows companies to keep track of causes and effects and make the right management decisions.
Today we’ll discuss metrics that help a company to understand its market standing, where it is successful, and where it is worth reviewing some processes.
While communicating with our customers, we have identified fifteen metrics that FMCG manufacturers and distributors are monitoring or strive to monitor on an ongoing basis to ensure increase in sales.
Table of Сontents
Inventory and production management
These metrics track the efficiency of supply chain operations and production processes. They help optimize resource allocation, reduce costs, and ensure smooth operational workflows.
1. Supply Chain Performance (DIFOT: delivery in full, on time) shows the quantity of ordered goods that were delivered to stores on time and in the right quantity. By maintaining a track record of OTIF, companies understand the performance of their supply chain.
This indicator helps to identify problems with order execution and reliability of suppliers. It is calculated as the ratio of timely deliveries in the quantity ordered to the total deliveries and multiplied by 100. It is recommended to keep this indicator at 90% and above.
2. Sold Products within Freshness Date measures the percentage of products sold within the freshness date of the total number of goods. Expired products are one of the sources of losses for an FMCG company, so it is important to keep track of the products sold within due date and try to increase it. To do this, companies run promotions and offer discounts for goods that may soon become “expired”.
But there is one problem: if a company wants 100% of its products to be sold and have no expired products, it must be prepared for an out-of-stock situation.
In the real world, it is almost impossible to accurately calculate the volume of supplies and the time frame within which the products will be sold. Therefore, you have to face a trade-off between the availability of your products on the shelves and sales within their expiration date.
3. Out-of-Stock Rate shows the percentage of an item that is out of stock at any given time. It is important for businesses that the store is able to replenish stockouts at any time and display these goods. It is believed that the lack of goods drives demand.
But this statement is controversial in relation to FMCG. If a customer fails to find his favorite brand of milk in the store several times, the customer will switch to another brand, rather than look for it in neighboring stores. According to studies, the out-of-stock (OOS) rate should be kept below 10%.
4. On-Shelf Availability — is the number of goods that customers can purchase in the store at a certain time. There are multiple reasons for out-of-shelves items: inaccurate sales forecasts, poor supply chain performance or logistics, excessive workload of merchandisers or store staff who do not have time to deliver the items to shelves.
Out-of-shelves items have a direct impact on sales to the manufacturer, so companies definitely need to monitor this indicator.
5. Inventory Turnover Ratio (ITR) shows the efficiency of a company’s inventory management. According to Statista, the global average inventory loss rate in the FMCG industry was 2.85% in 2023. This means that companies failed to receive revenue from almost 3% of their inventories.
Therefore, companies need to understand how long it takes to sell the average stock of goods in the warehouse. For this they need to know their ITR. This can be done in two ways: calculate the ratio of the cost of goods sold to the average annual inventory balance or the ratio of revenue to the average annual inventory balance.
Knowing the inventory turnover ratio, the company can calculate the turnover ratio in days. Using this indicator, they can determine how many days the warehouse stocks will last for stable sales, or the materials at the enterprise will last for the production of the required quantity of goods.
6. Reject rate shows the share of defective SKUs in the total amount of goods. A high percentage of defects in an FMCG company may result in loss of confidence of counterparties, financial losses and loss of market power. Therefore, it is important to monitor product quality to avoid these problems.
Customer relationship management and marketing

The following metrics help understand the efficiency of working with customers and marketing activities. They are important for building long-term relations with consumers.
7. Market share is the percentage of total sales that a company or product holds. This metric allows assessing competitive performance, planning marketing strategies correctly, identifying growth drivers, etc.
The FMCG market is changing rapidly, so it is essential for companies to continuously monitor this indicator over time and make timely adjustments to their strategy.
8. Return On Marketing Investment (ROMI) assists in understanding how much marketing costs have paid off: TV advertising, online advertising, billboards, email campaigns, etc. This metric shows which strategies work best and allows companies to allocate budget and resources more objectively. ROMI is the ratio of marketing revenue to marketing investment as a percentage.
9. Customer satisfaction level shows how much the consumers are happy about the quality of company’s goods and services. In the FMCG sphere, this indicator must be controlled, as the consumers have many similar goods on shelves in the store.
The manufacturers must constantly monitor customer feedback, conduct polls and analyze customer behavior in sales outlets. Low satisfaction level leads to reduced loyalty and transition of customers to the competitors.
10. Repeat purchase rate reflects the number of customers making repeat purchases of a certain brand over an established period. This indicator is especially important for assessment of customer loyalty and efficiency of retaining programs.
Companies with a high repeat purchase rate have more stable profits and can predict future sales with greater accuracy. Low values of this indicator may signal, for example, problems with the quality of goods or pricing policy.
11. Customer attraction cost includes general marketing costs as well as sales required to attract a new customer. In the conditions of high competition in the FMCG segment, this indicator helps optimize the marketing budget.
Companies must regularly analyze the efficiency of various customer attraction channels and redistribute resources in favor of the most efficient ones. Overly high attraction costs may indicate low efficiency of marketing campaigns.
12. Customer lifetime value represents the total profit that the company receives from one customer throughout the period of their purchasing activity. This indicator helps understand how much it costs to invest into attracting and retaining a specific consumer segment.
FMCG companies use this indicator to make decisions on loyalty programs, personalized offers and investments into improving customer service. Profitable customers compensate for large investments into product quality and personal service.
Financial efficiency and profitability

13. Sales Volume and Margin by Product Category will help businesses understand their strong areas. In terms of sales volume, it is important to monitor the plan/actual figures to let you know if you are behind the planned goals or not.
This information will help companies identify issues and find their reasons. Margin by product category helps you determine how much of each euro or dollar made in sales actually stays with your company.
14. EBITDA profitability demonstrates operating profits of the company before interest, taxes, depreciation and amortization. This indicator makes it possible to assess real efficiency of the core activity of an FMCG company.
It is important for FMCG manufacturers to monitor the dynamics of this indicator, since it reflects how successfully the company optimizes operating costs. The higher the EBITDA profitability, the more efficiently the company manages its costs relative to its profits, and the better its standing as compared to the competitors.
15. Sustainability indicators. According to the latest trends, sustainability is an essential factor in the market success of an FMCG company. Buyers are becoming more environmentally conscious and more demanding when choosing products.
Therefore, FMCG companies today need to monitor and improve indicators such as carbon dioxide emissions, packaging efficiency, waste management, utilization rate of recycled resources, etc.
According to Nielsen’s Global Corporate Sustainability report, 81% of people around the world believe that companies should help preserve and improve the environment.
KPIs must be aligned with strategies

Keeping track of KPIs helps companies to ensure sales control, determine their strengths and weaknesses; understand whether the current strategy is well-performing and get answers to many questions.
Keep in mind that companies evaluate each process: logistics, marketing, sales, etc.
In order not to be swamped with an immense amount of data, select key indicators that will demonstrate business performance and meet the company’s goals at the moment, for example, some indicators will be tracked to expand market representation, and others will be tracked to increase revenue from online channels.
FAQ
On-shelf availability ensures that products are always present for consumers. Continuous tracking helps avoid lost sales and maintain customer loyalty.
The out-of-stock rate measures how often products are missing from shelves. A high rate signals supply chain or replenishment issues that need to be addressed quickly.
Share of shelf is the percentage of shelf space occupied by a brand’s products compared to competitors. A larger share often leads to higher visibility and sales.
Planogram compliance measures how accurately store displays match the planned layout. High compliance improves product visibility and increases the effectiveness of merchandising strategies.
Regular price monitoring helps manufacturers stay competitive, quickly respond to market changes, and prevent pricing errors or inconsistencies across different retail locations.