
In the fast-paced world of modern retail, one truth has become crystal clear: standard analytics tools aren’t enough. They show too much or too little, often out of context. For retail leaders, trade marketing professionals, CPG brands, and distributors, the need is clear — precise, customized insights that reflect your products, your regions, and your competitive environment. Welcome to the world of custom retail analytics.
This article explores how tailored analytics tools are helping companies solve real challenges: stockouts, inventory waste, poor promotion ROI, competitive blind spots, and decision-making delays. We’ll break down how leading businesses use custom dashboards to track product availability, monitor competitors, reduce losses, and integrate data into a single source of truth.
Key Takeaways:
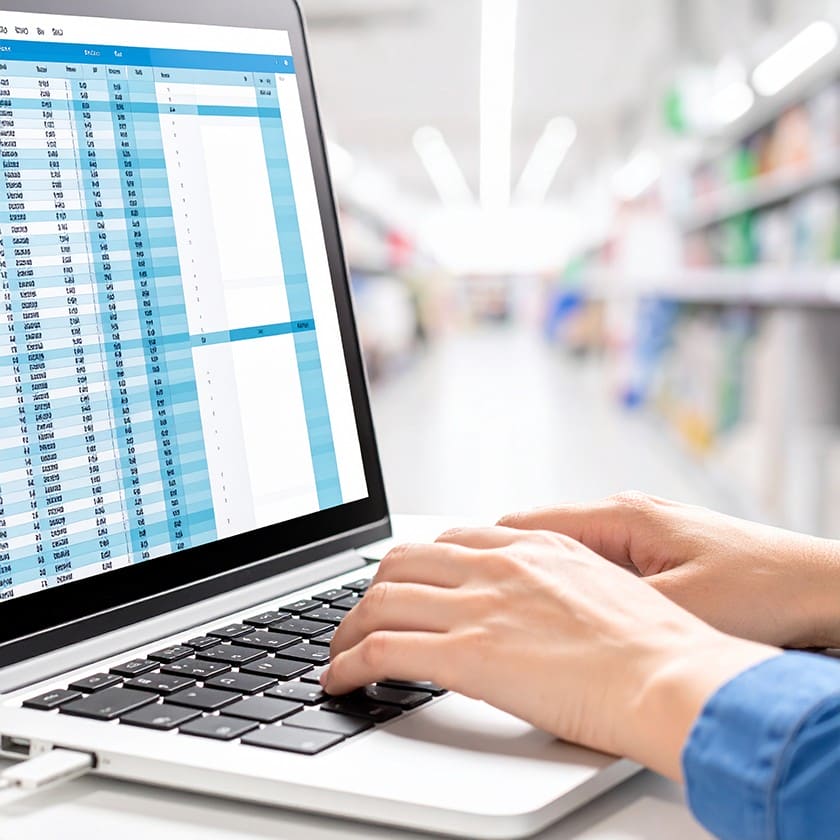
- Standard Analytics Fall Short. Generic dashboards show irrelevant data while 63% of supply chain leaders still use Excel, creating inefficiencies and blind spots.
- Stockouts Cost $1.2 Trillion Globally. Poor visibility causes massive losses, with 31% of customers switching retailers when products are unavailable. Custom analytics can improve on-shelf availability by 11 percentage points.
- Real-Time Competitive Intelligence Drives Results. Tracking competitor pricing and shelf share in real-time enables faster responses and up to 25% higher margins.
- Data Integration Saves Significant Time. Unified dashboards eliminate juggling multiple systems, saving 6-8 hours per analyst weekly—equivalent to 23 extra workdays per year.
- Proven ROI Across Key Metrics. Custom analytics delivers up to 10% margin increases, prevents 8% revenue loss from stockouts, and provides 30% time savings for reporting teams.
Table of Сontents
- The Problem with Standardized Retail Analytics
- What Is Custom Retail Analytics?
- Why Product Availability Must Be Granular
- How Custom Analytics Reduce Stockouts and Revenue Loss
- Monitoring Competitor Assortment and Pricing in Real Time
- The Power of Unified Dashboards and Data Integration
- How Key Retail Stakeholders Use Custom Analytics
- What’s the ROI of Going Custom?
- Summary: From Visibility to Profitability
- FAQ
The Problem with Standardized Retail Analytics
Generic dashboards try to serve everyone. But that makes them serve no one particularly well.
You’ve likely seen the problems firsthand:
- Flooded dashboards filled with irrelevant KPIs.
- National or global metrics when you only need city-level insight.
- Inability to compare specific SKUs across competitors.
- Poor responsiveness when a product is missing in stores.
These issues translate to lost sales, missed opportunities, and operational inefficiencies. According to industry research, 63% of supply chain leaders still rely on Excel to track inventory. That’s not just inefficient — it’s risky.
When shelf execution is inconsistent and data lives in silos, opportunities slip through the cracks. Custom analytics aims to fix exactly that.
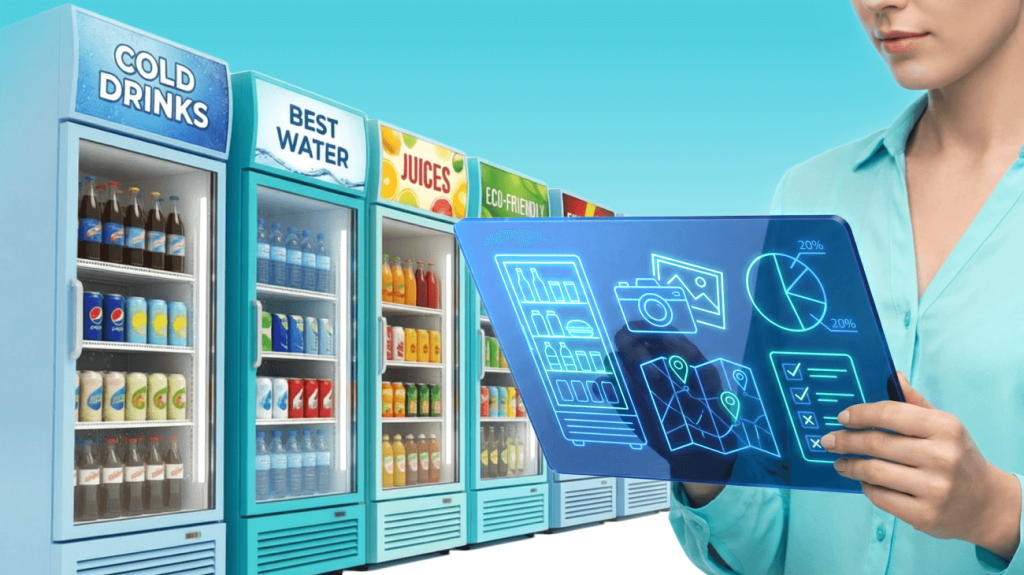
What Is Custom Retail Analytics?
Custom retail analytics is the use of tailored dashboards, data pipelines, and KPIs built around your specific business model. Unlike standardized tools, they don’t show data that isn’t relevant — they show only the data that drives action.
This might include tracking product availability by region, chain, store, or SKU, setting up daily alerts when stock drops below critical thresholds, creating visualized heatmaps that reveal assortment gaps, or monitoring price and promotional activity by competitor, category, or city.
These systems integrate with existing retail management platforms, inventory systems, and point-of-sale data to deliver timely, actionable insights that go beyond what standard analytics packages typically offer. Their key advantage lies in specificity: while generic tools often require you to conform to predefined metrics and workflows, custom analytics are tailored to reflect your unique operational needs, seasonal trends, and strategic goals.
Instead of wasting time on dashboards designed for someone else, your team gets clean, filtered views that reflect what your people need to make fast, smart decisions.
Why Product Availability Must Be Granular

Stockouts cost retailers over $1.2 trillion globally each year. The problem isn’t always poor supply — it’s poor visibility.
Retailers and suppliers rarely know where exactly a product is missing, why stock didn’t arrive or wasn’t placed on the shelf, or which regions are trending toward depletion. Custom analytics platforms fix this with real-time tracking at the most granular level, providing SKU-by-store stock dashboards that show precise inventory positioning, region-level performance maps that highlight geographic trends and opportunities, and automatic alerts that flag anomalies before they become critical issues.
This granular visibility transforms guesswork into data-driven decision making, allowing teams to identify root causes of stockouts, predict demand patterns across different markets, and proactively address supply chain disruptions before they impact sales performance.
Imagine knowing on Monday morning that SKU A is already understocked in Region 3 and will sell out by Wednesday. That’s what predictive analytics, powered by tailored data, can do.
In fact, retailers using real-time inventory analytics improve on-shelf availability by up to 11 percentage points, according to pilot studies.
How Custom Analytics Reduce Stockouts and Revenue Loss

Stockouts do more than hurt today’s sales — they reduce customer satisfaction, damage brand reputation, and push shoppers to competitors. Studies show that 31% of customers who find a product out-of-stock will switch retailers, while 24% abandon the purchase entirely, representing lost revenue that extends far beyond the immediate transaction.
With custom analytics, companies can track out-of-stock frequency by individual store locations, automatically trigger replenishment alerts when inventory falls below optimal levels, detect root causes such as late deliveries or planogram noncompliance, and align store staff around execution priorities that matter most.
These systems provide the visibility needed to prevent stockouts before they occur, rather than simply reacting after customers have already been disappointed.
In one rollout, a global food brand improved cooler compliance by 80% using photo-based shelf audits fed into a custom dashboard, enabling real-time monitoring of product placement and availability. They saw double-digit sales lifts in key regions as a result, demonstrating how targeted analytics can translate directly into measurable business outcomes and stronger competitive positioning.
Monitoring Competitor Assortment and Pricing in Real Time

You can’t win in retail without knowing what your competitors are doing. But most off-the-shelf analytics tools ignore this entirely.
Custom analytics tools, on the other hand, allow you to:
- Track shelf share by brand or category.
- Analyze pricing vs. key competitors.
- Detect new product entries in your segments.
- Benchmark assortment coverage city-by-city.
Real-time scraping, store audits, or retailer data integrations can power these dashboards. The result? Faster reaction to competitive threats and smarter trade execution.
Retailers that use advanced pricing and assortment analytics enjoy up to 25% higher margins, according to McKinsey.
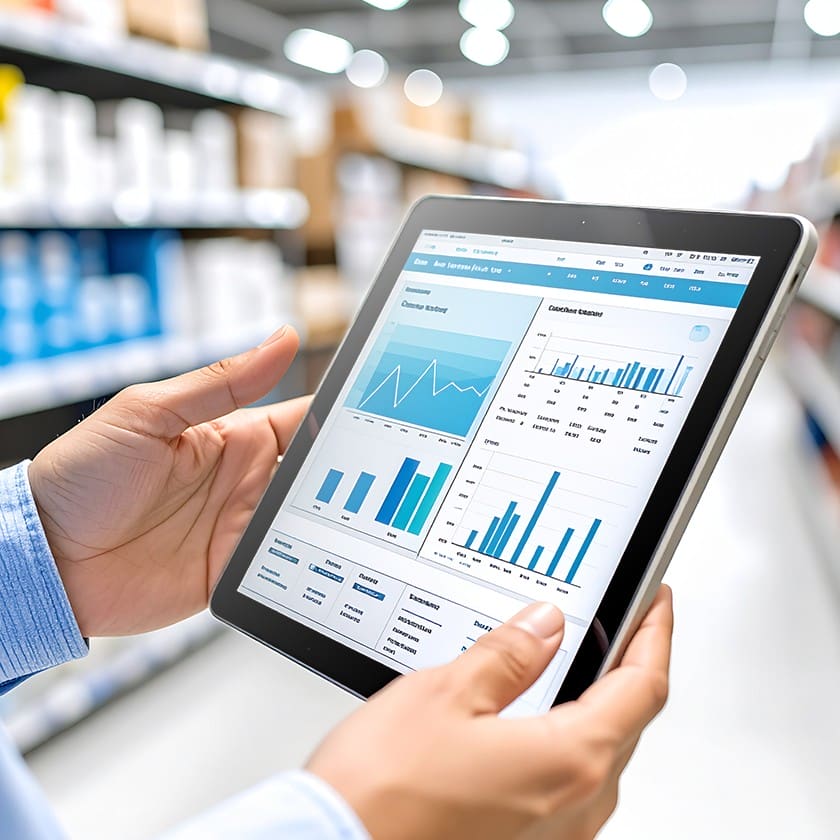
The Power of Unified Dashboards and Data Integration

Most retail organizations use multiple systems including POS systems, inventory and warehouse management tools, market research portals, and promotion planners, creating data silos that slow down decision-making. Custom analytics brings these together into one unified dashboard that pulls from all your sources, eliminating the need to log into five different platforms and manually merge spreadsheets.
This integration delivers faster decision-making capabilities, eliminates time-consuming manual reporting processes, and ensures consistent metrics across all departments. Companies that automate reporting through custom analytics save 6–8 hours per analyst per week, and decision speed increases dramatically when teams can access comprehensive insights from a single interface
In one case, a retail team saved 3.6 hours per week per user—the equivalent of an extra 23 workdays per year—while simultaneously improving data accuracy and reducing the risk of errors that come from manual data manipulation. This time savings allows analysts to focus on strategic insights rather than data collection, fundamentally changing how retail teams operate and compete.
How Key Retail Stakeholders Use Custom Analytics

Let’s look at how different roles benefit from tailored analytics.
Manufacturers (CPG Brands)
Custom analytics enables monitoring of shelf presence, compliance, and competitor activity through automated photo audits that show percentage shelf share for your brand by region.
Solutions like Goods Checker exemplify this capability, using computer vision to automatically recognize products and POSM on shelves, compare them against planograms, and generate accurate compliance reports without manual intervention.
This capability delivers higher promotional effectiveness, better shelf compliance, and measurable sales uplift by ensuring products are properly positioned and merchandised according to planogram specifications.
Distributors
Custom analytics optimizes deliveries, tracks performance by individual outlet, and reduces both overstock and understock situations by providing visibility into which stores are underperforming versus forecast and enabling automatic adjustment of routing.
These insights drive lower logistics costs, higher service levels, and fewer missed sales by ensuring the right products reach the right locations at the optimal time.
Retailers (Chains or Independents)
Custom analytics enables localized assortment optimization, improves in-stock percentages, and facilitates dynamic pricing by providing real-time alerts when competitors drop prices on key SKUs within the same city.
This approach results in better margins, increased conversion rates, and more repeat customers by ensuring pricing strategies remain competitive while inventory matches local demand patterns.
Trade Marketing Teams
Custom analytics monitors promotion execution, tracks ROI, and enables competitive comparison by providing real-time visibility into which stores haven’t started promotional campaigns, allowing teams to immediately dispatch representatives for corrective action.
This functionality delivers improved promotional compliance, reduced waste, and higher returns per campaign by ensuring marketing investments are executed consistently across all locations.
What’s the ROI of Going Custom?
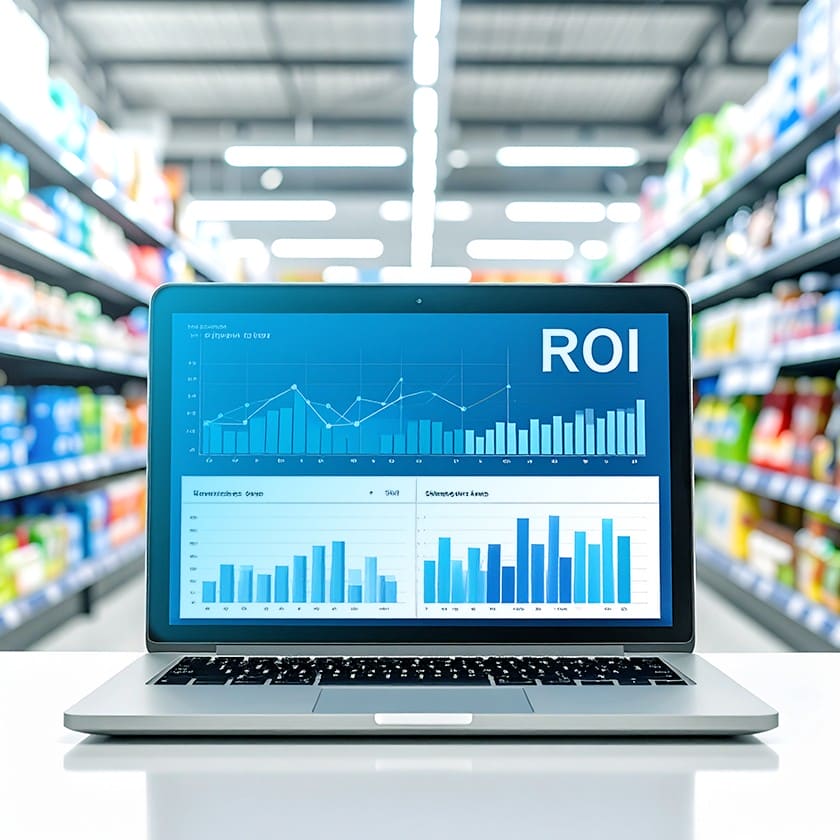
Custom analytics pays off through:
- Recaptured sales from fewer stockouts.
- Higher promo ROI.
- Leaner inventory with fewer overstocks.
- Less time spent on manual reporting.
Estimated results:
- Up to 10% margin increase from pricing optimization.
- 8% revenue loss prevented by avoiding out-of-stocks.
- Up to 30% time savings for reporting teams.
- Better strategic decisions driven by visibility.
These are not theoretical. Companies who invest in tailored tools see measurable results. And unlike black-box AI systems, custom analytics can be designed around your processes and KPIs.
Summary: From Visibility to Profitability
In a competitive retail environment, standard analytics simply don’t cut it anymore. Brands, retailers, and distributors are shifting to custom analytics that fit their workflows, reflect their geography, and highlight what they care about.
The result?
- Better in-stock performance.
- Faster competitive response.
- Smarter pricing and assortment.
- Unified decision-making from store to HQ.
GoodsChecker helps businesses build exactly this kind of system — whether you’re a national brand or a regional distributor. Our tailored dashboards and integrations give you the insights you need to move faster, reduce losses, and grow profitably.